

Embarking on a journey to monitor Docker containers? Let's walk through setting up a robust monitoring system using Prometheus, cAdvisor, and Grafana on an EC2 instance. Buckle up as we unravel the steps to create a seamlessly integrated Docker monitoring environment.
Step 1: Prepare Your EC2 Instance
Begin by creating an EC2 instance. While a t2.micro will suffice, we recommend using a t2.medium for enhanced performance. Ensure that Docker is installed, and don't forget to update the system:
sudo apt update
sudo apt install -y docker.io
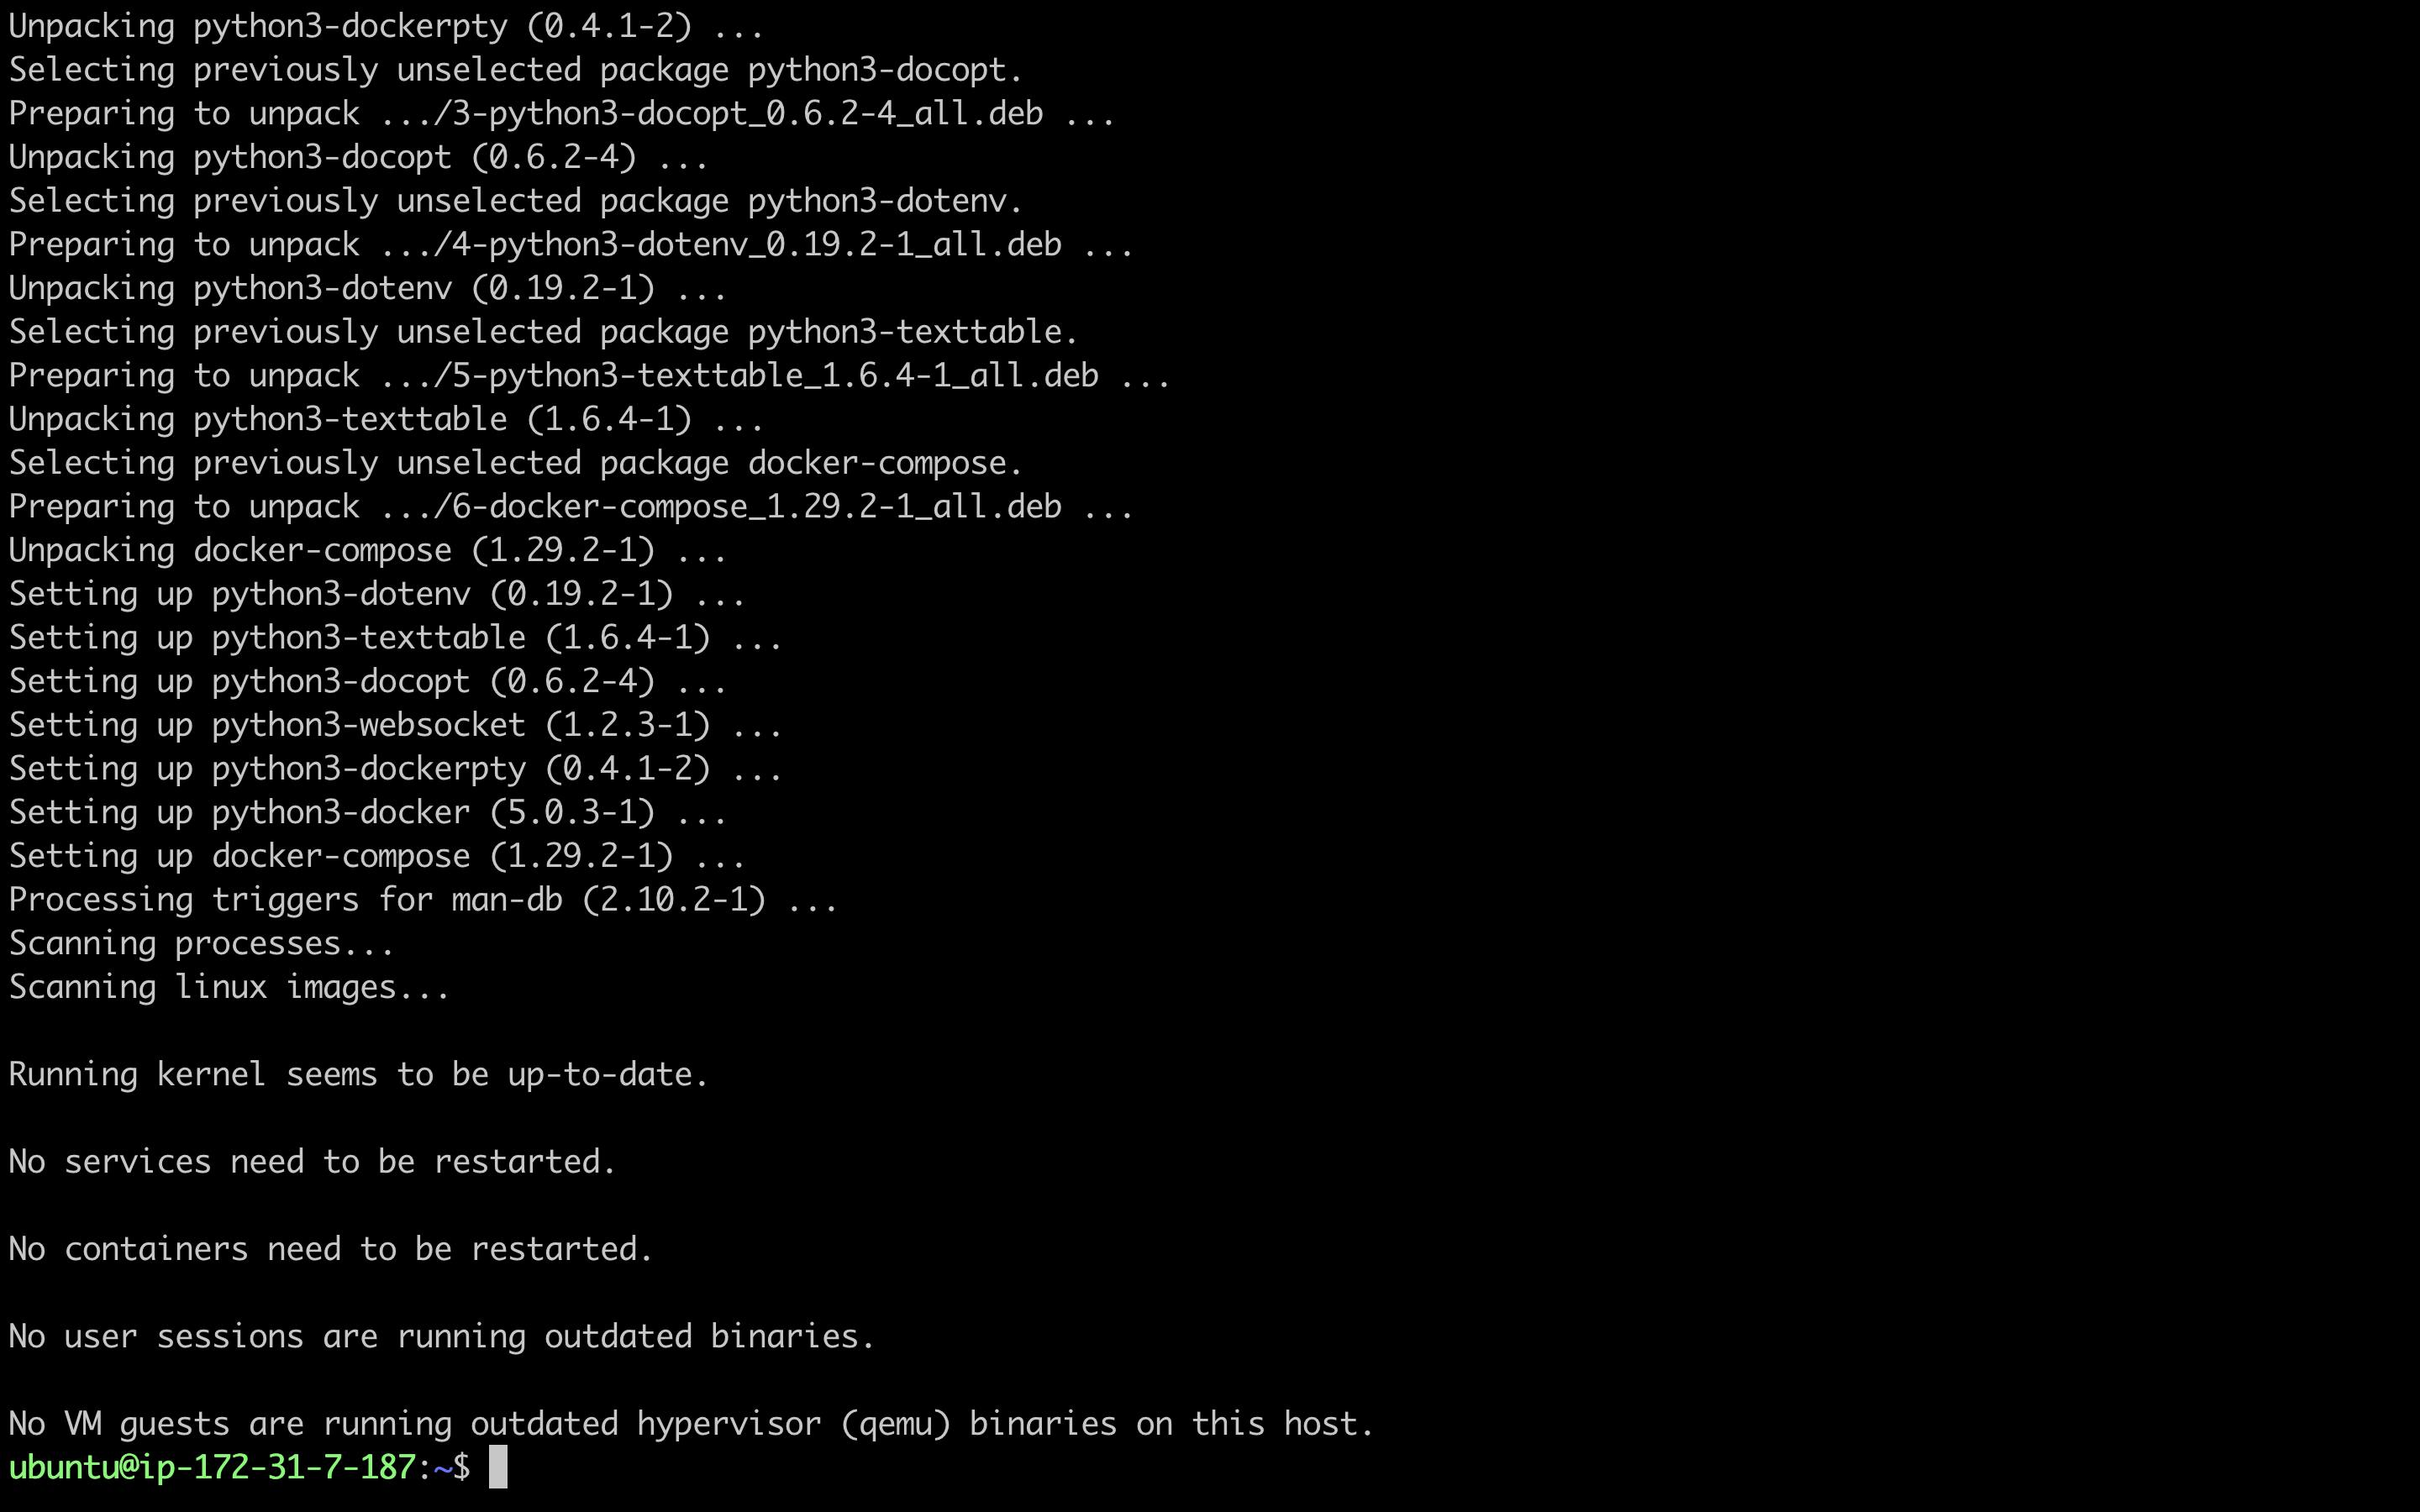
sudo apt install -y docker-compose
Step 2: Configure Docker Permissions
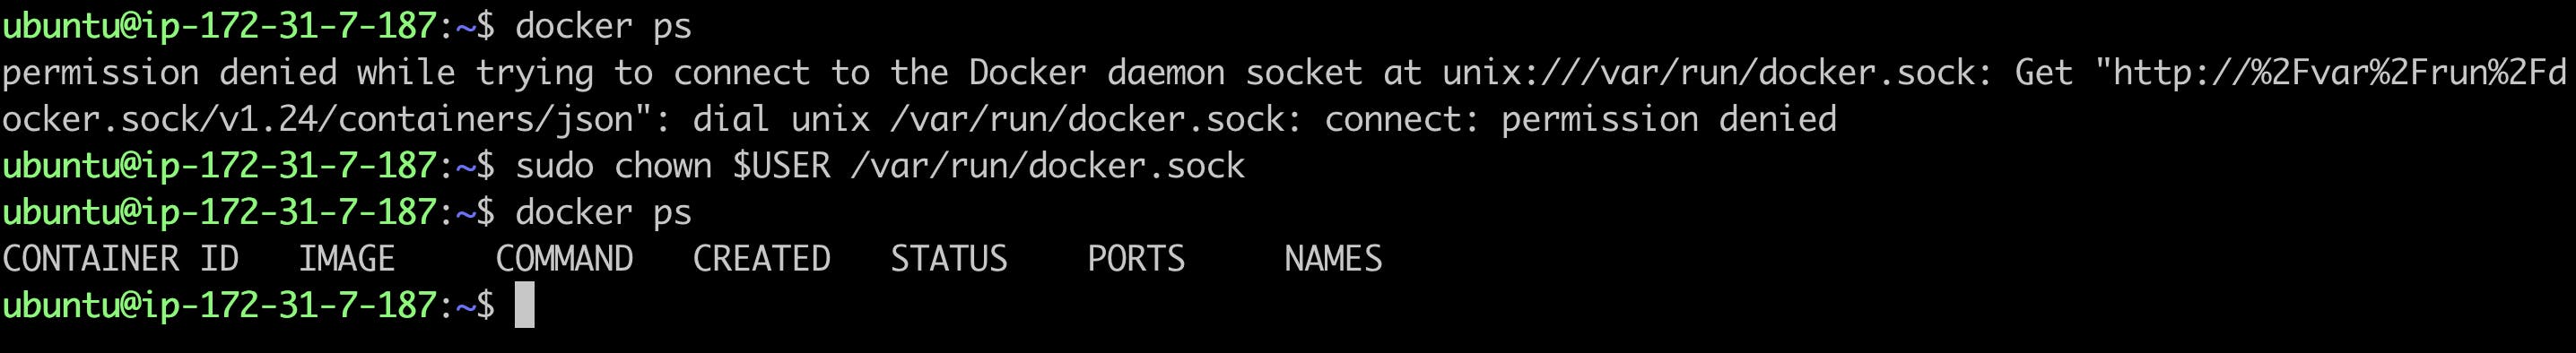
Now change the owner ship of docker.sock for the current user, we need to do it as we were getting permission denied ealier when we tired to execute docker ps command
sudo chown $USER /var/run/docker.sock
Step 3: Set Up Prometheus and cAdvisor
Create a directory for Prometheus, download the configuration file, and deploy Prometheus and cAdvisor
mkdir Prometheus
cd Prometheus
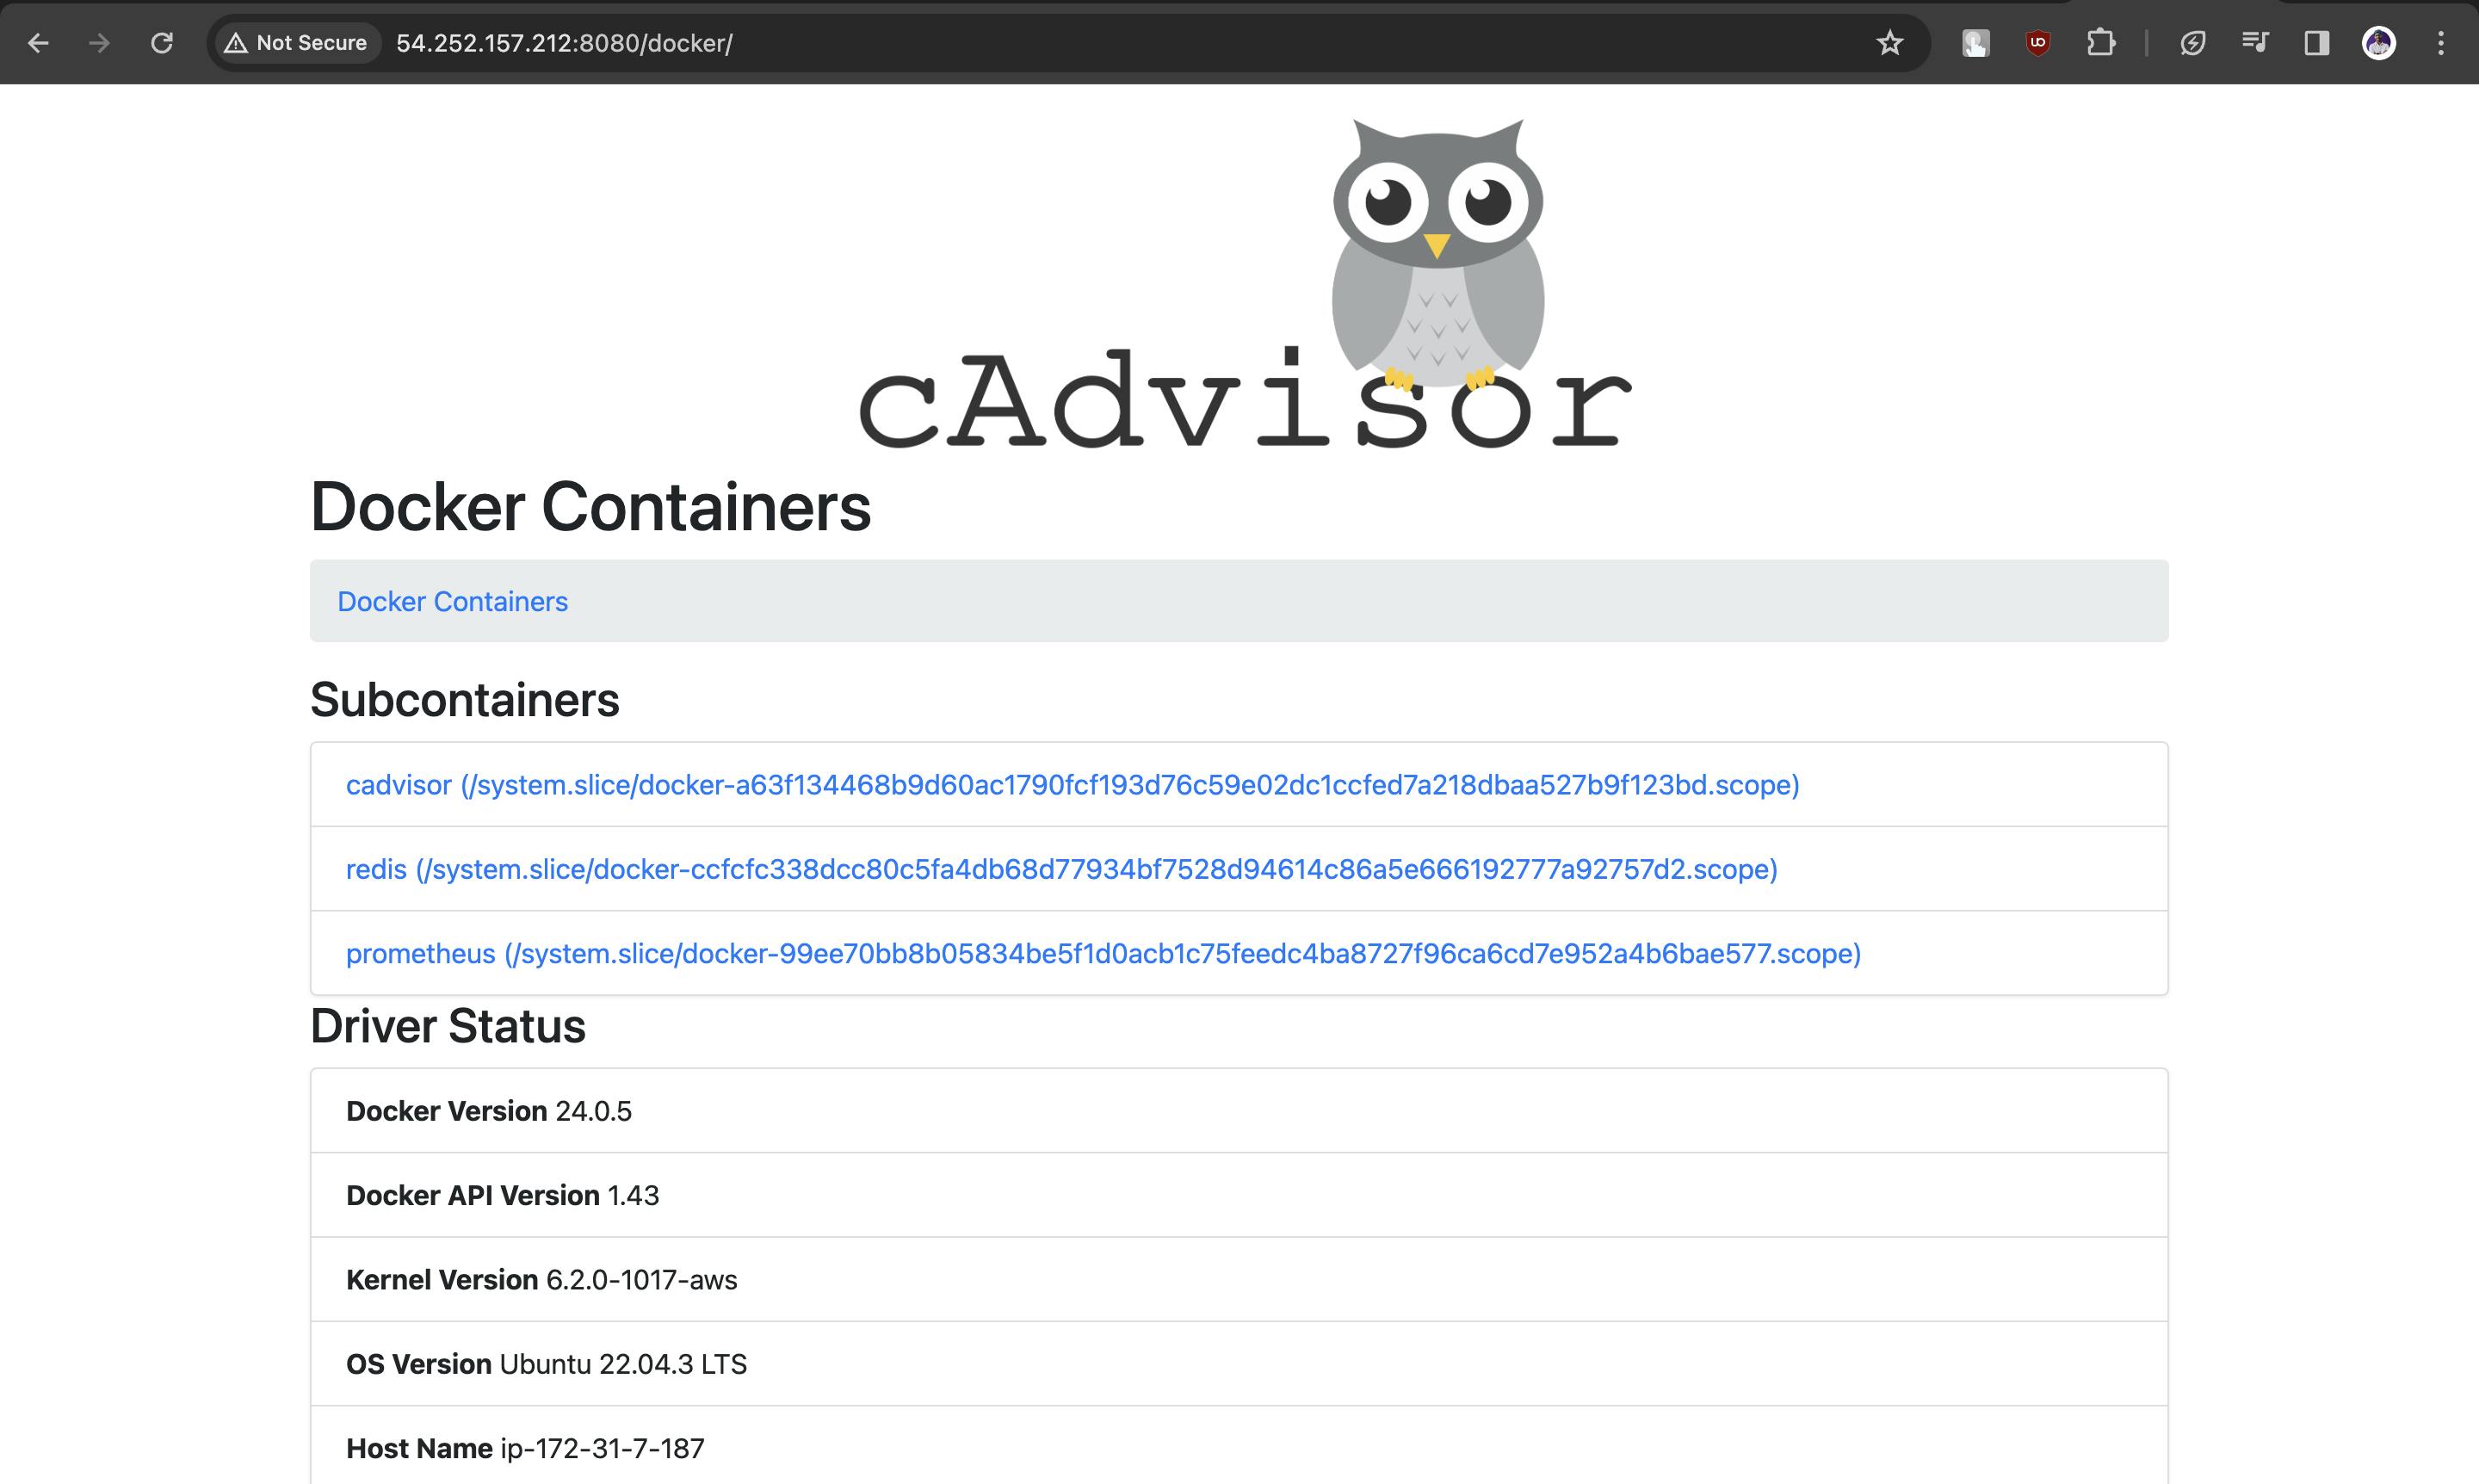
cAdvisor (short for container Advisor) analyzes and exposes resource usage and performance data from running containers. cAdvisor exposes Prometheus metrics out of the box.
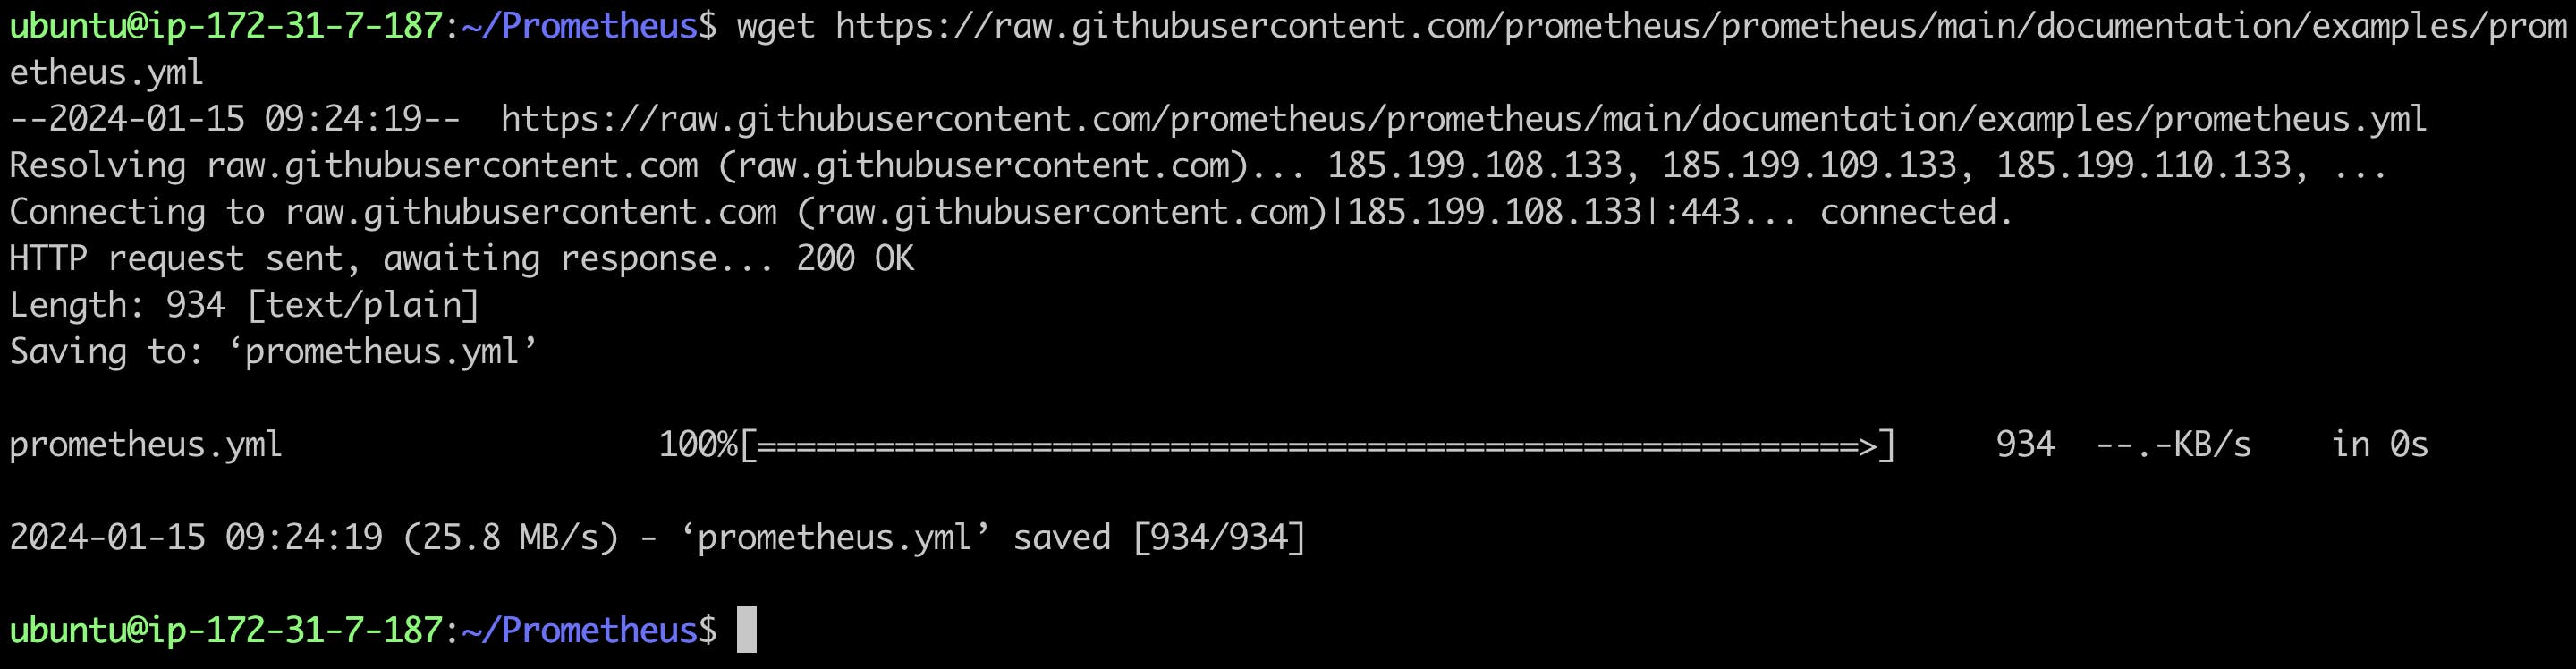
Download the prometheus config file
wget https://raw.githubusercontent.com/prometheus/prometheus/main/documentation/examples/prometheus.yml
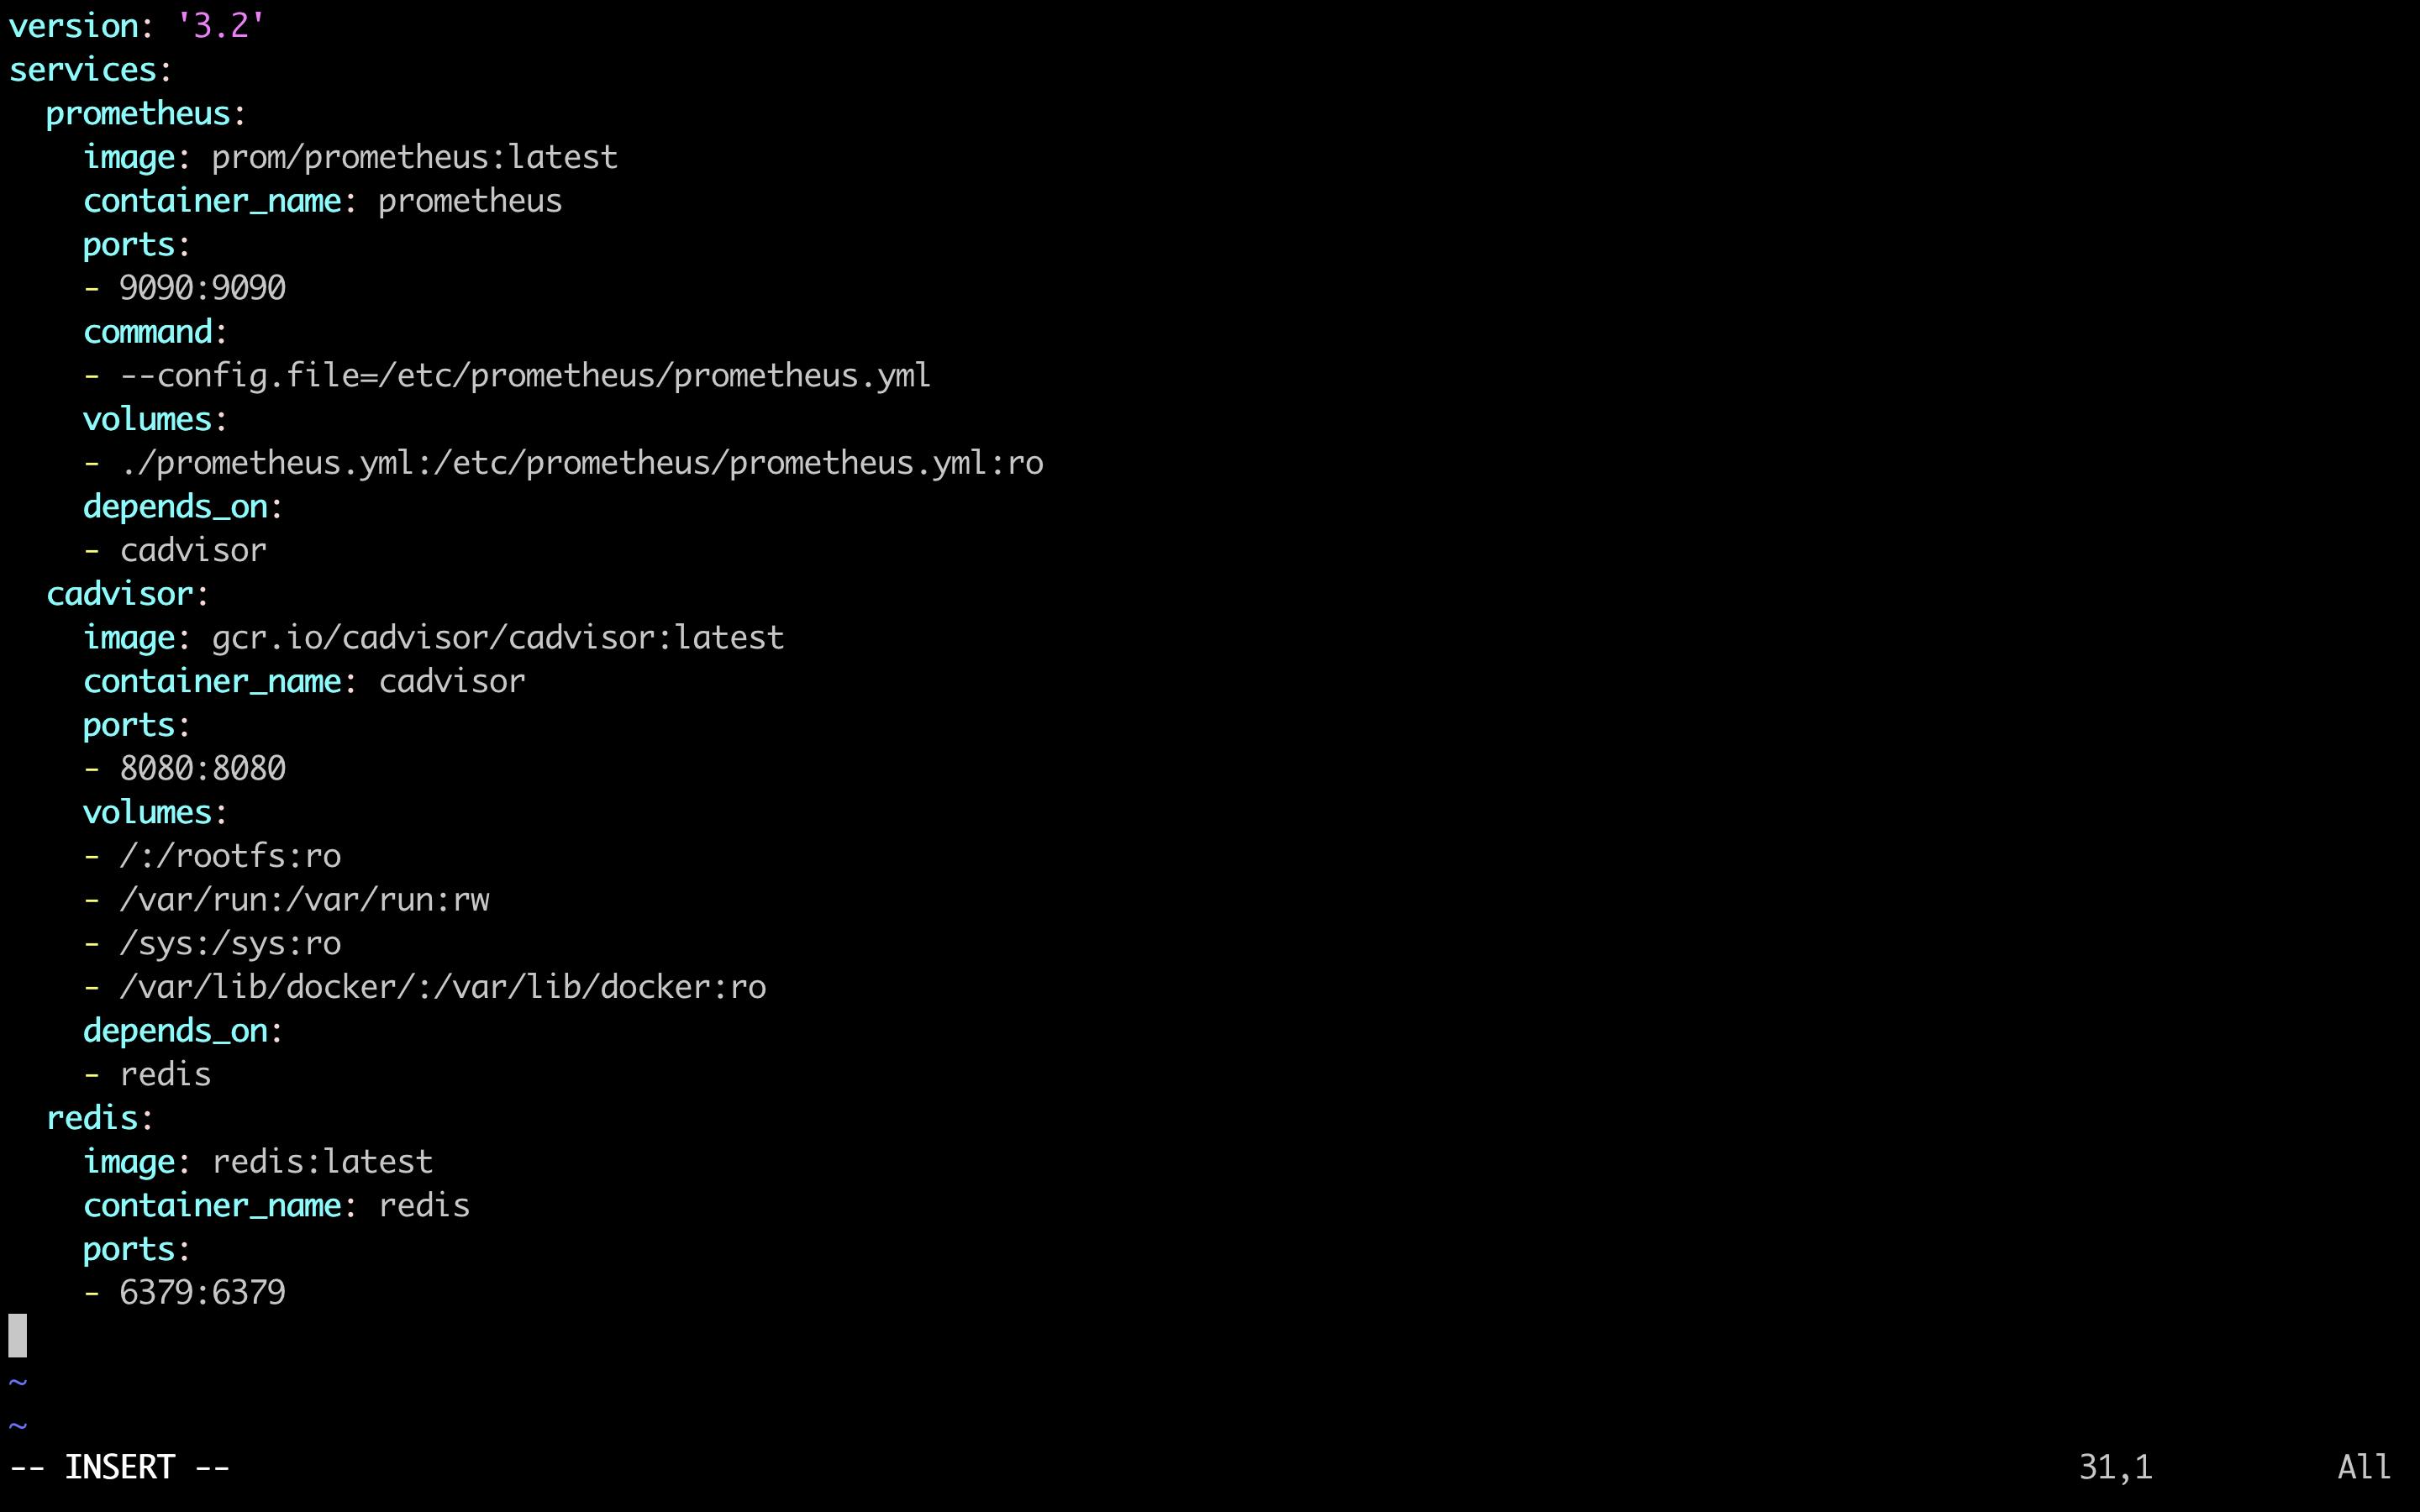
Now create a docker-compose file and enter the below in the compose file
version: '3.2'
services:
  prometheus:
    image: prom/prometheus:latest
    container_name: prometheus
    ports:
    - 9090:9090
    command:
    - --config.file=/etc/prometheus/prometheus.yml
    volumes:
    - ./prometheus.yml:/etc/prometheus/prometheus.yml:ro
    depends_on:
    - cadvisor
  cadvisor:
    image: gcr.io/cadvisor/cadvisor:latest
    container_name: cadvisor
    ports:
    - 8080:8080
    volumes:
    - /:/rootfs:ro
    - /var/run:/var/run:rw
    - /sys:/sys:ro
    - /var/lib/docker/:/var/lib/docker:ro
    depends_on:
    - redis
  redis:
    image: redis:latest
    container_name: redis
    ports:
    - 6379:6379
in the above compose file we are creating three services namely prometheus, redis and cadvisor
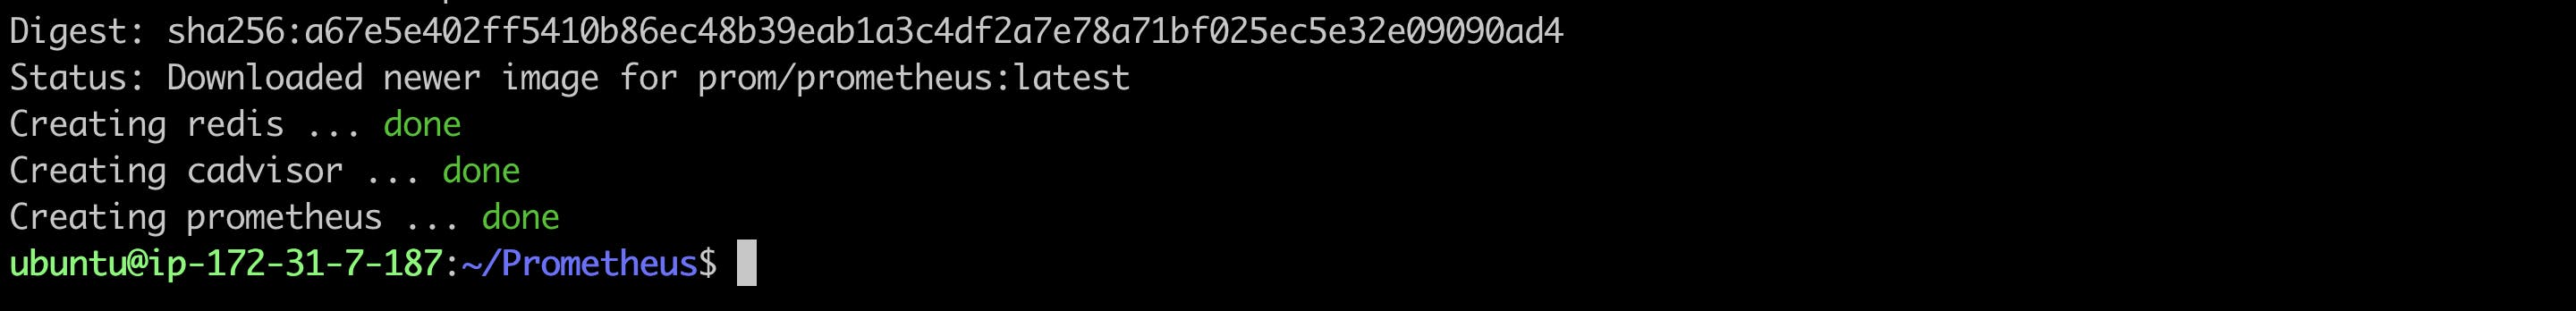
Now execute the compose file by entering the compose up command
docker-compose up -d
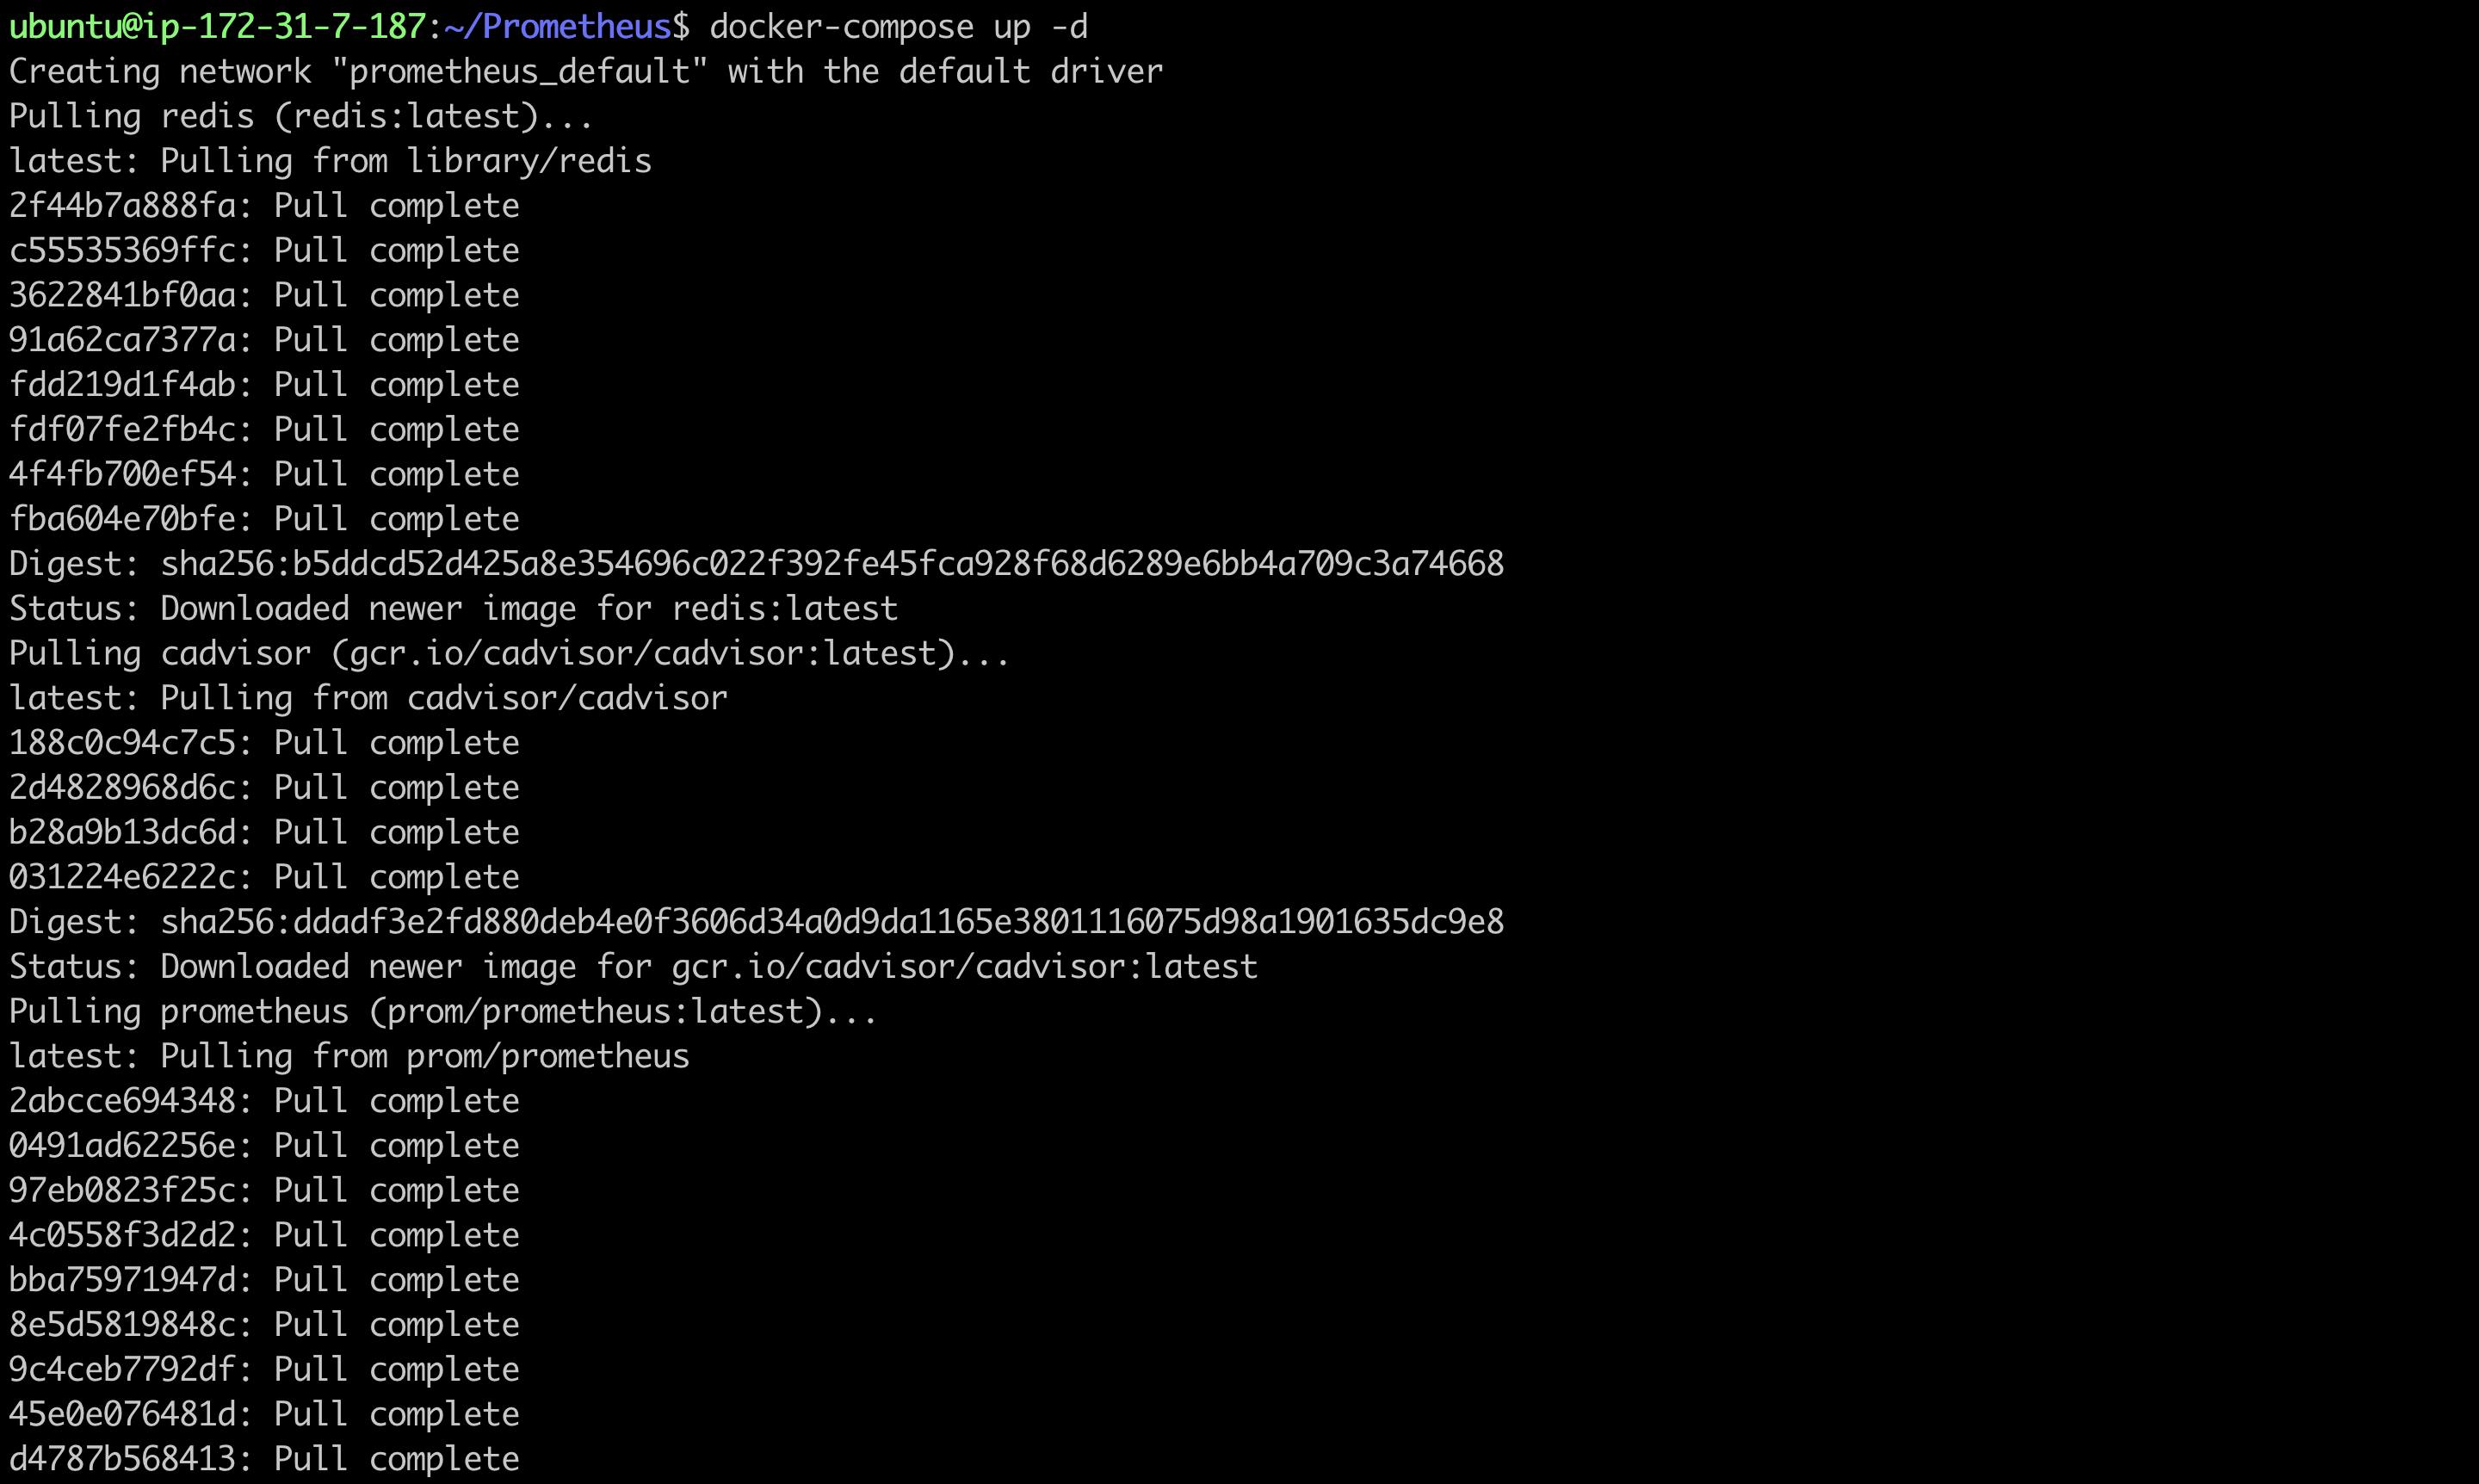
Upon Completion you should resemble like the below
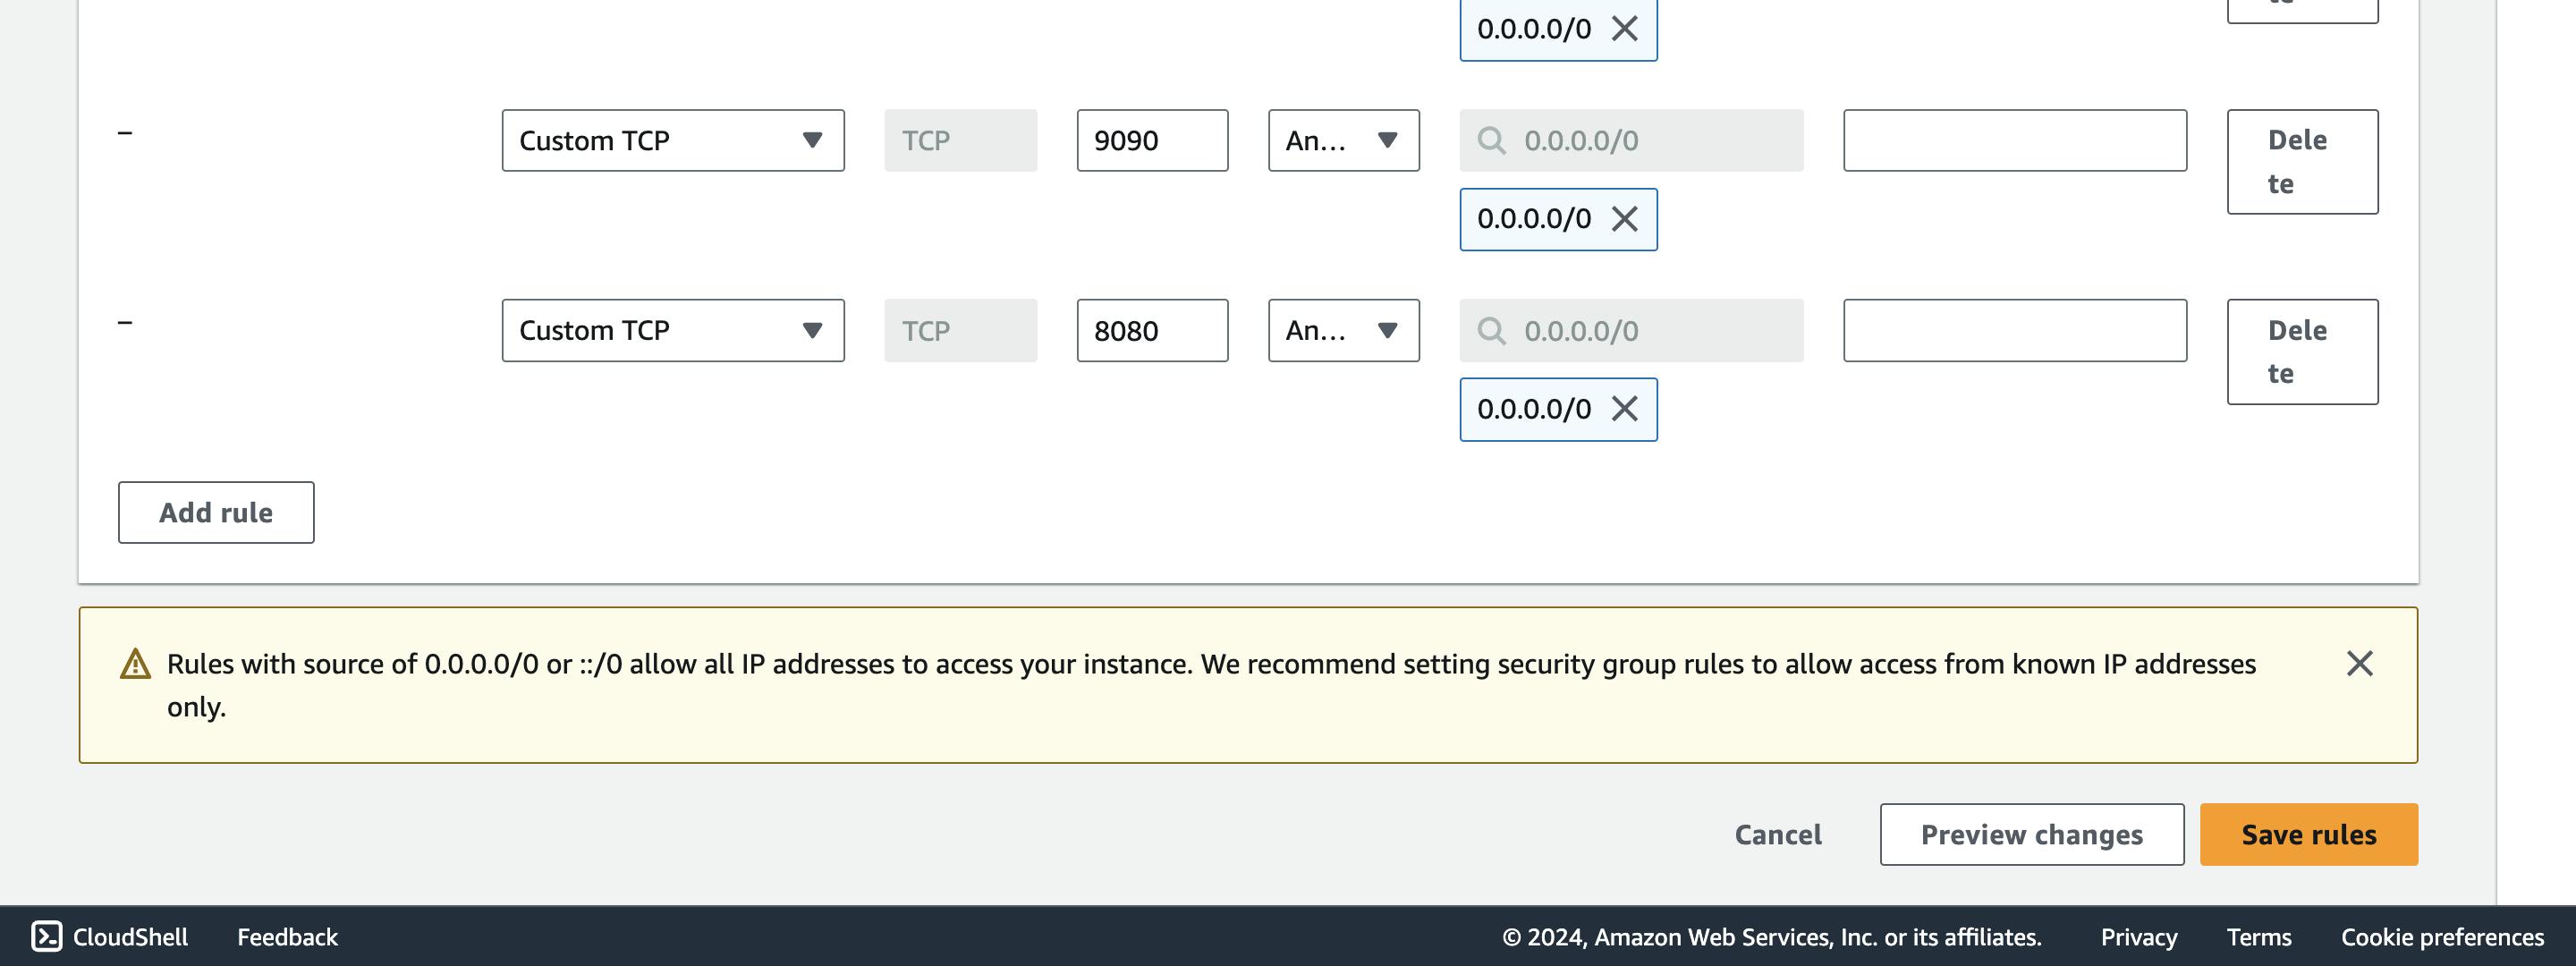
Step 4: Accessing Dashboards
Enable security group rules on AWS for ports 9090 (Prometheus) and 8080 (cAdvisor). Visit <public-ip>:9090 for Prometheus and <public-ip>:8080 for cAdvisor.
Dashboard for cadvisor can be access on browser by entering <public-ip>:8080
Similarly Prometheus dashboard can be accessed on browser by entering <public-ip>:9090
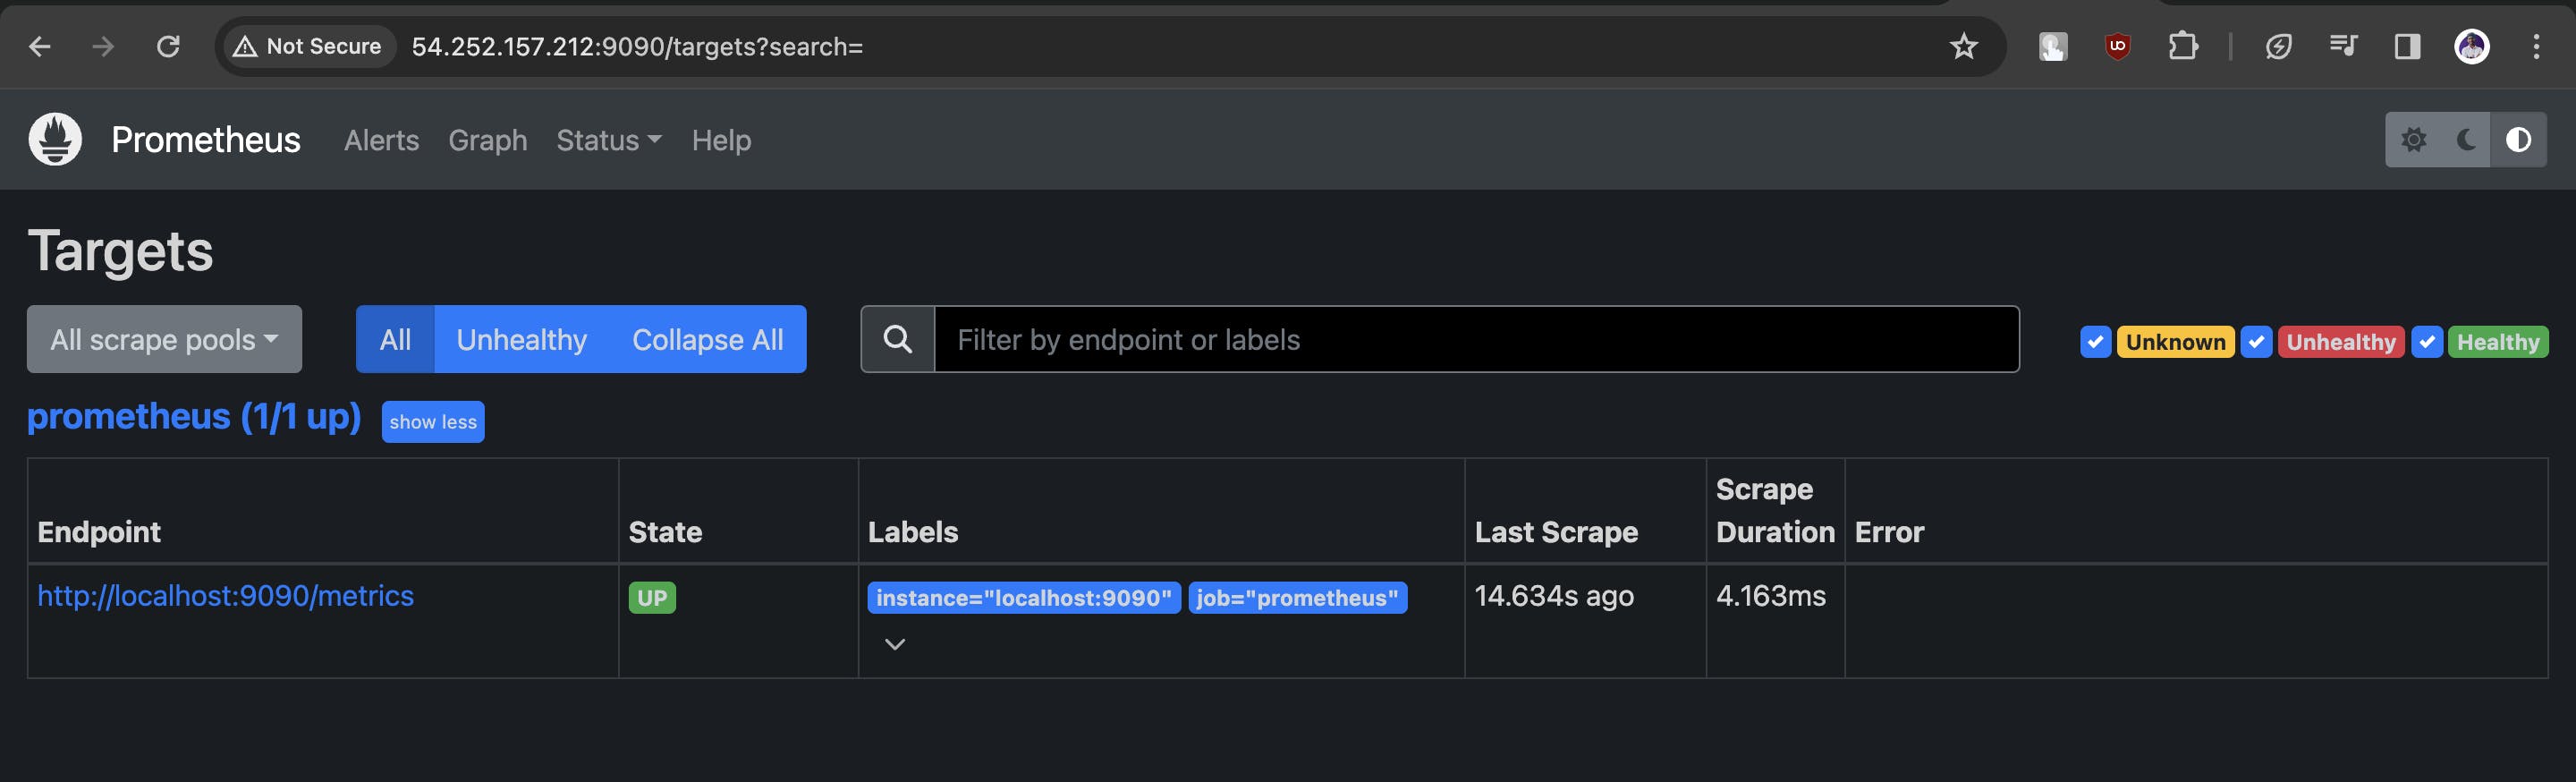
here we are only getting the metrics for prometheus we need to get the metrics of docker we need to make some configuration changes in prometheus.yml file
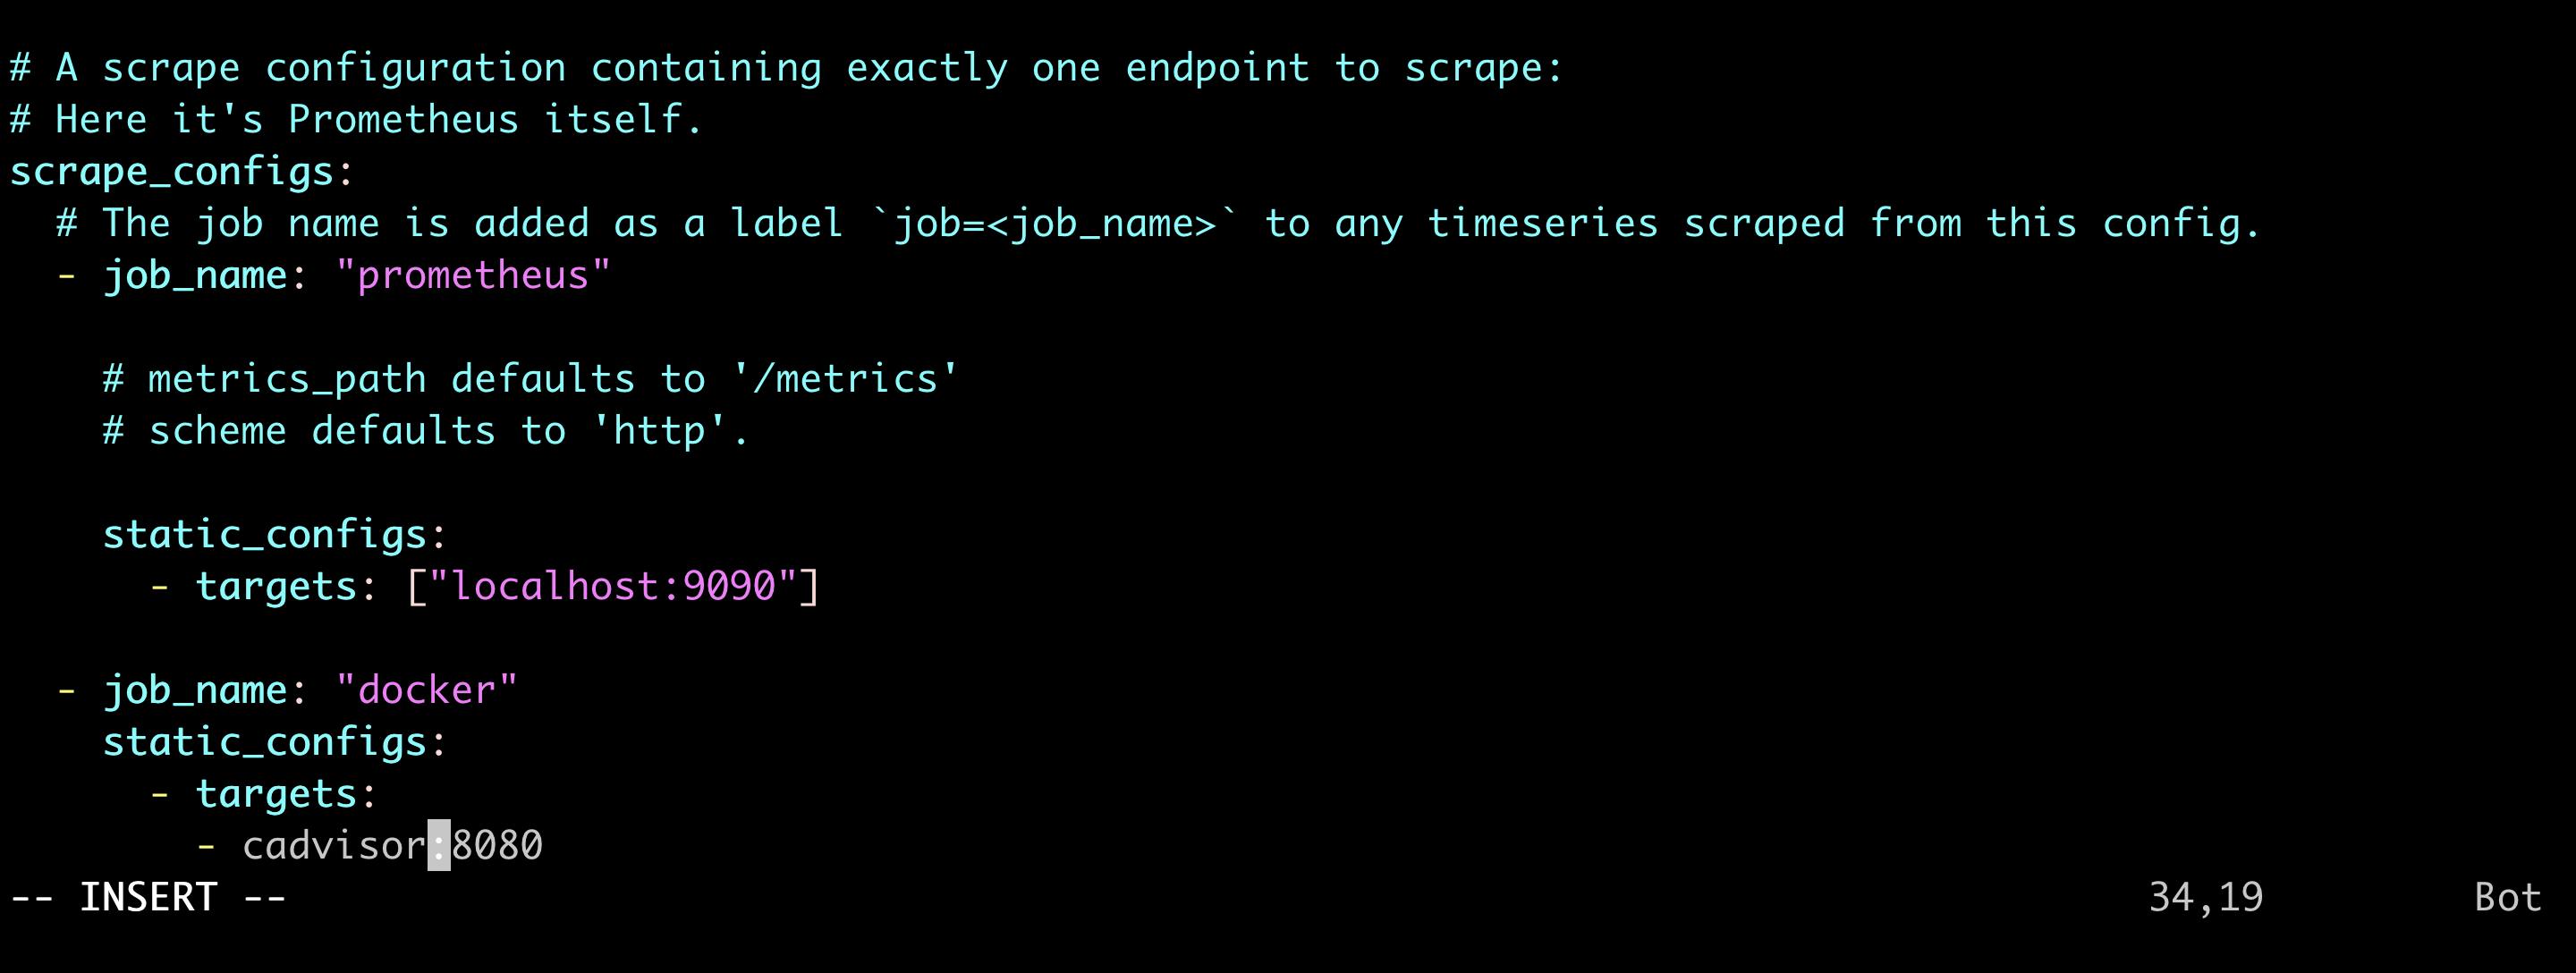
here we are adding a new job_name as docker which will displayed in the prometheus dashboard
Step 5: Extend Prometheus Metrics
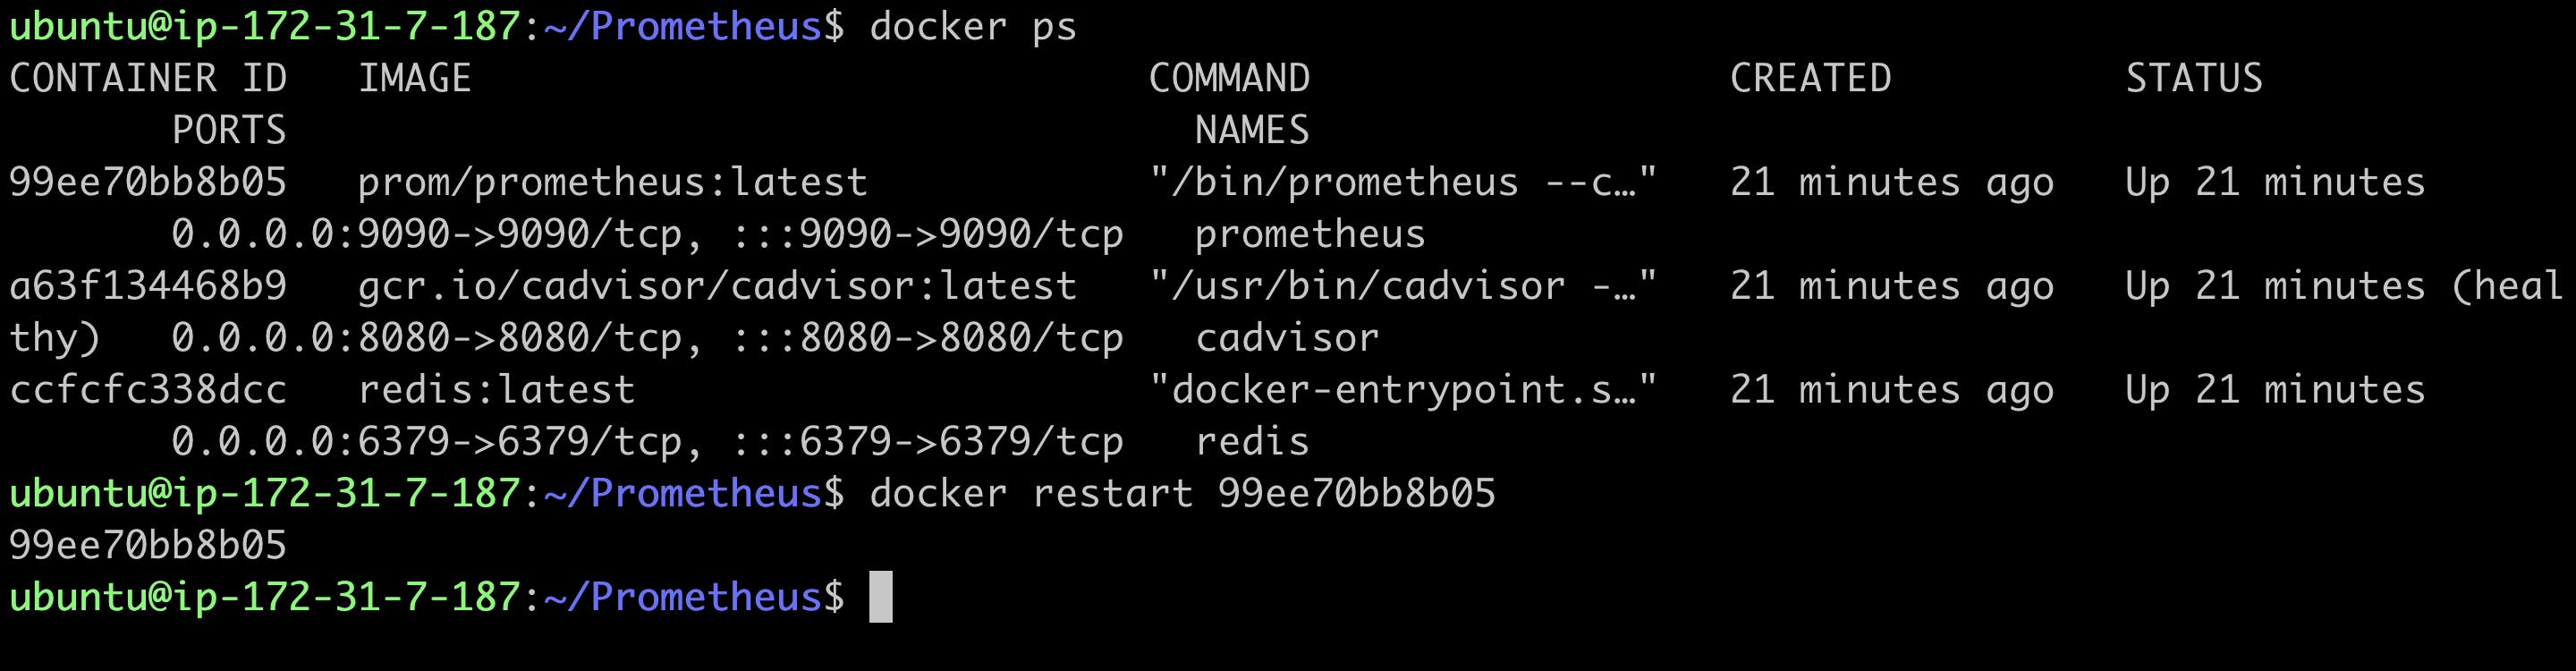
Now as we made the configuration change we will need to restart the docker container for prometheus
docker restart <container-id>
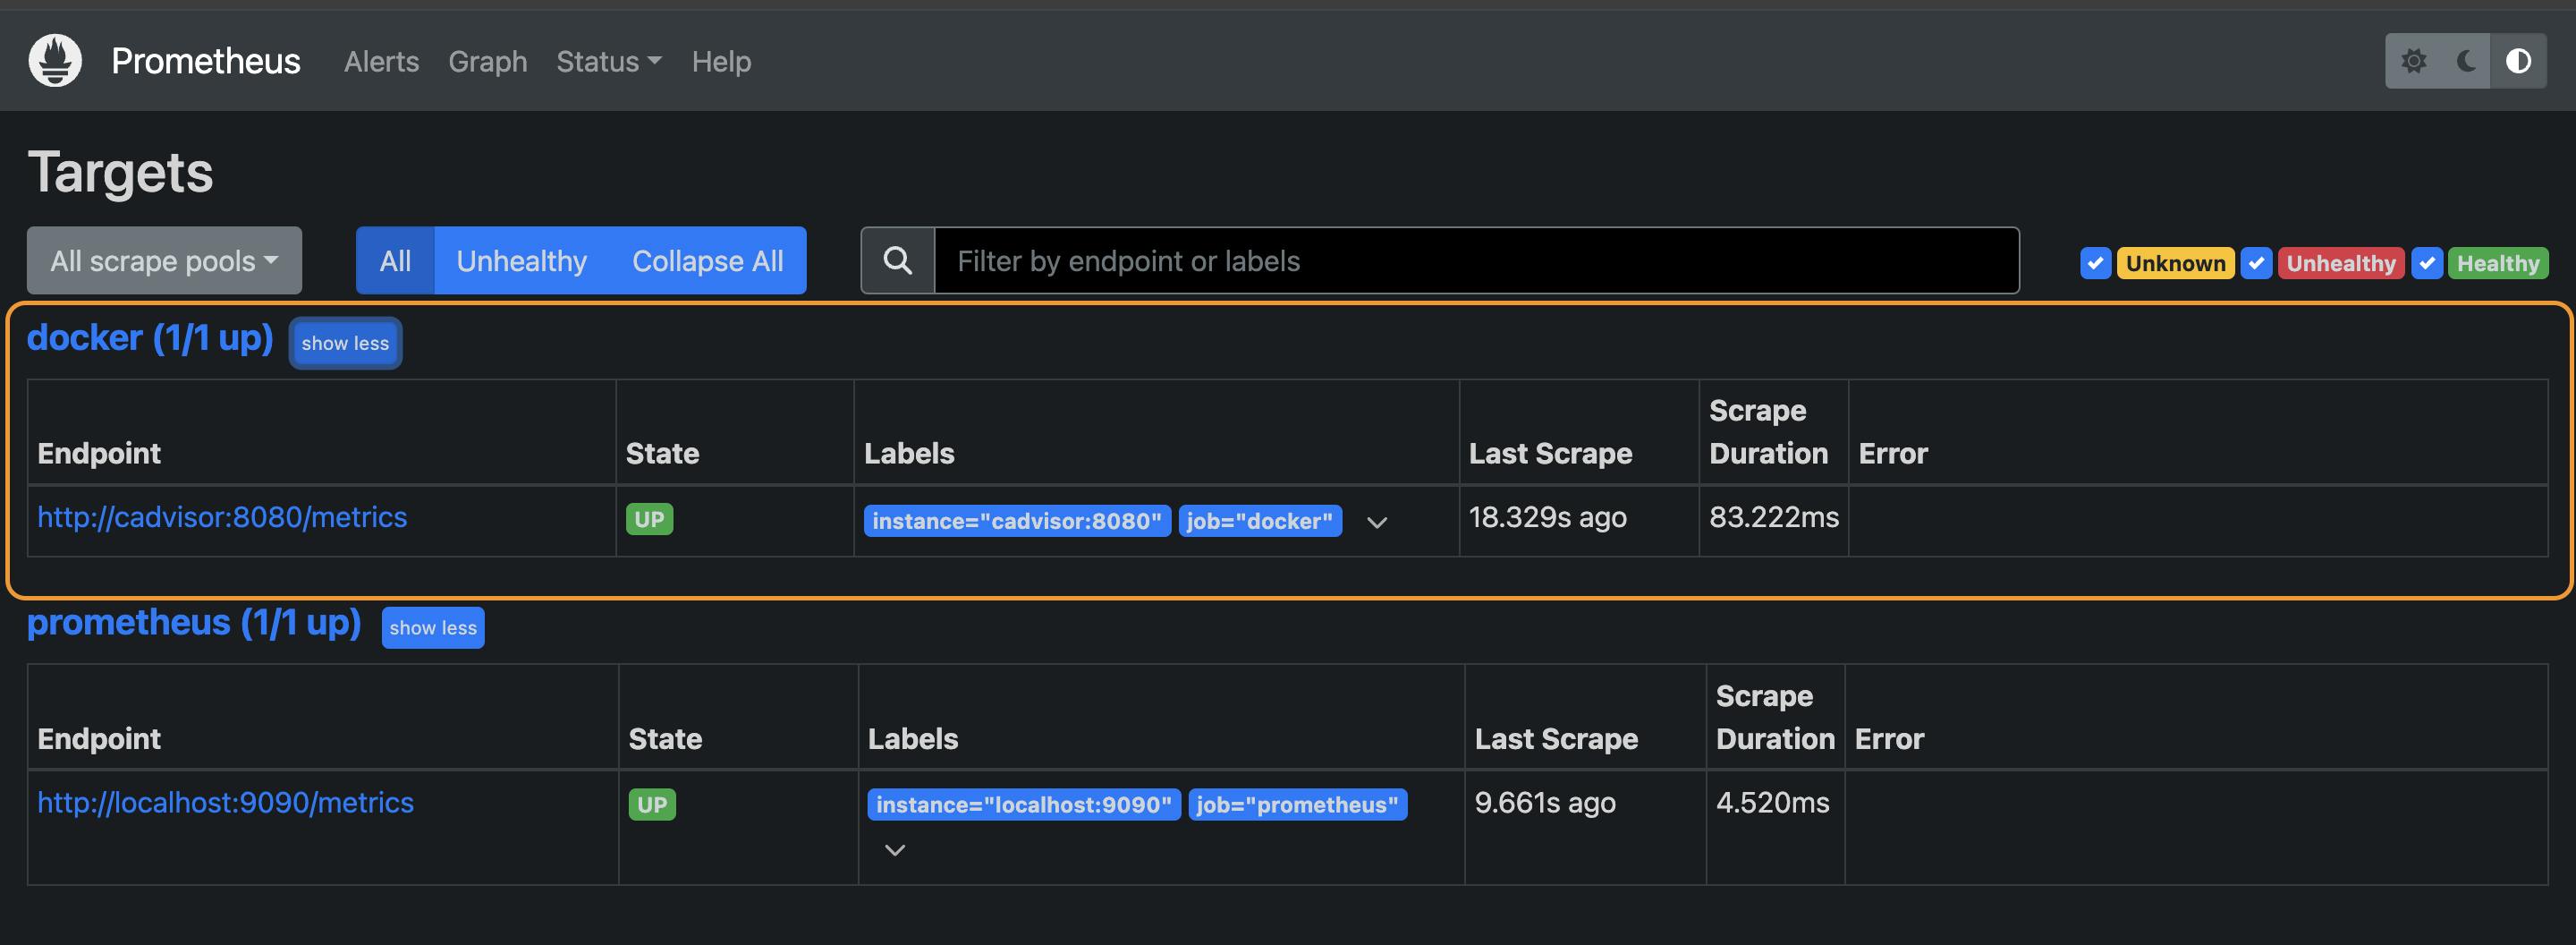
Now visit the Prometheus dashboard, you will see docker listed up here
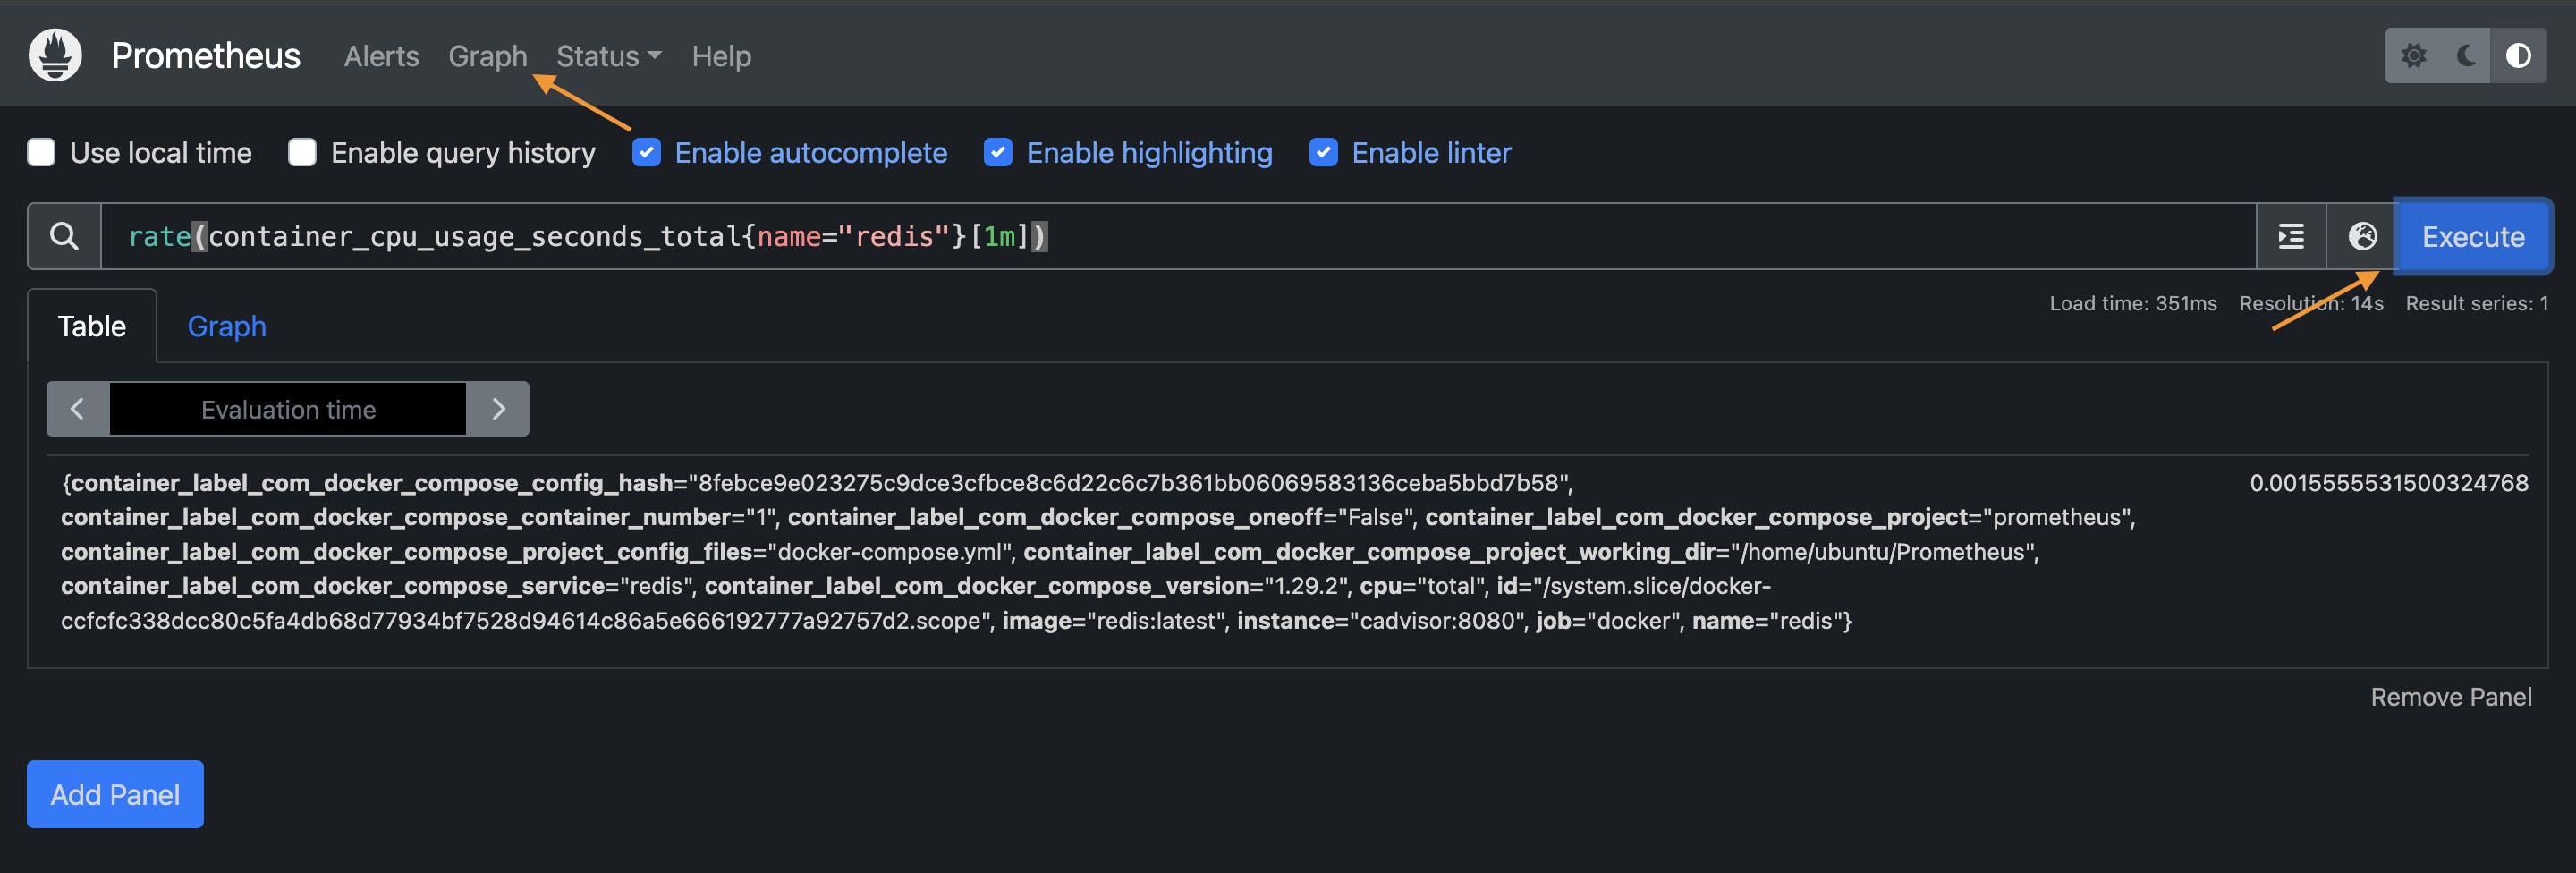
Now let's test the dashboard by running the PromQL for redis
rate(container_cpu_usage_seconds_total{name="redis"}[1m])
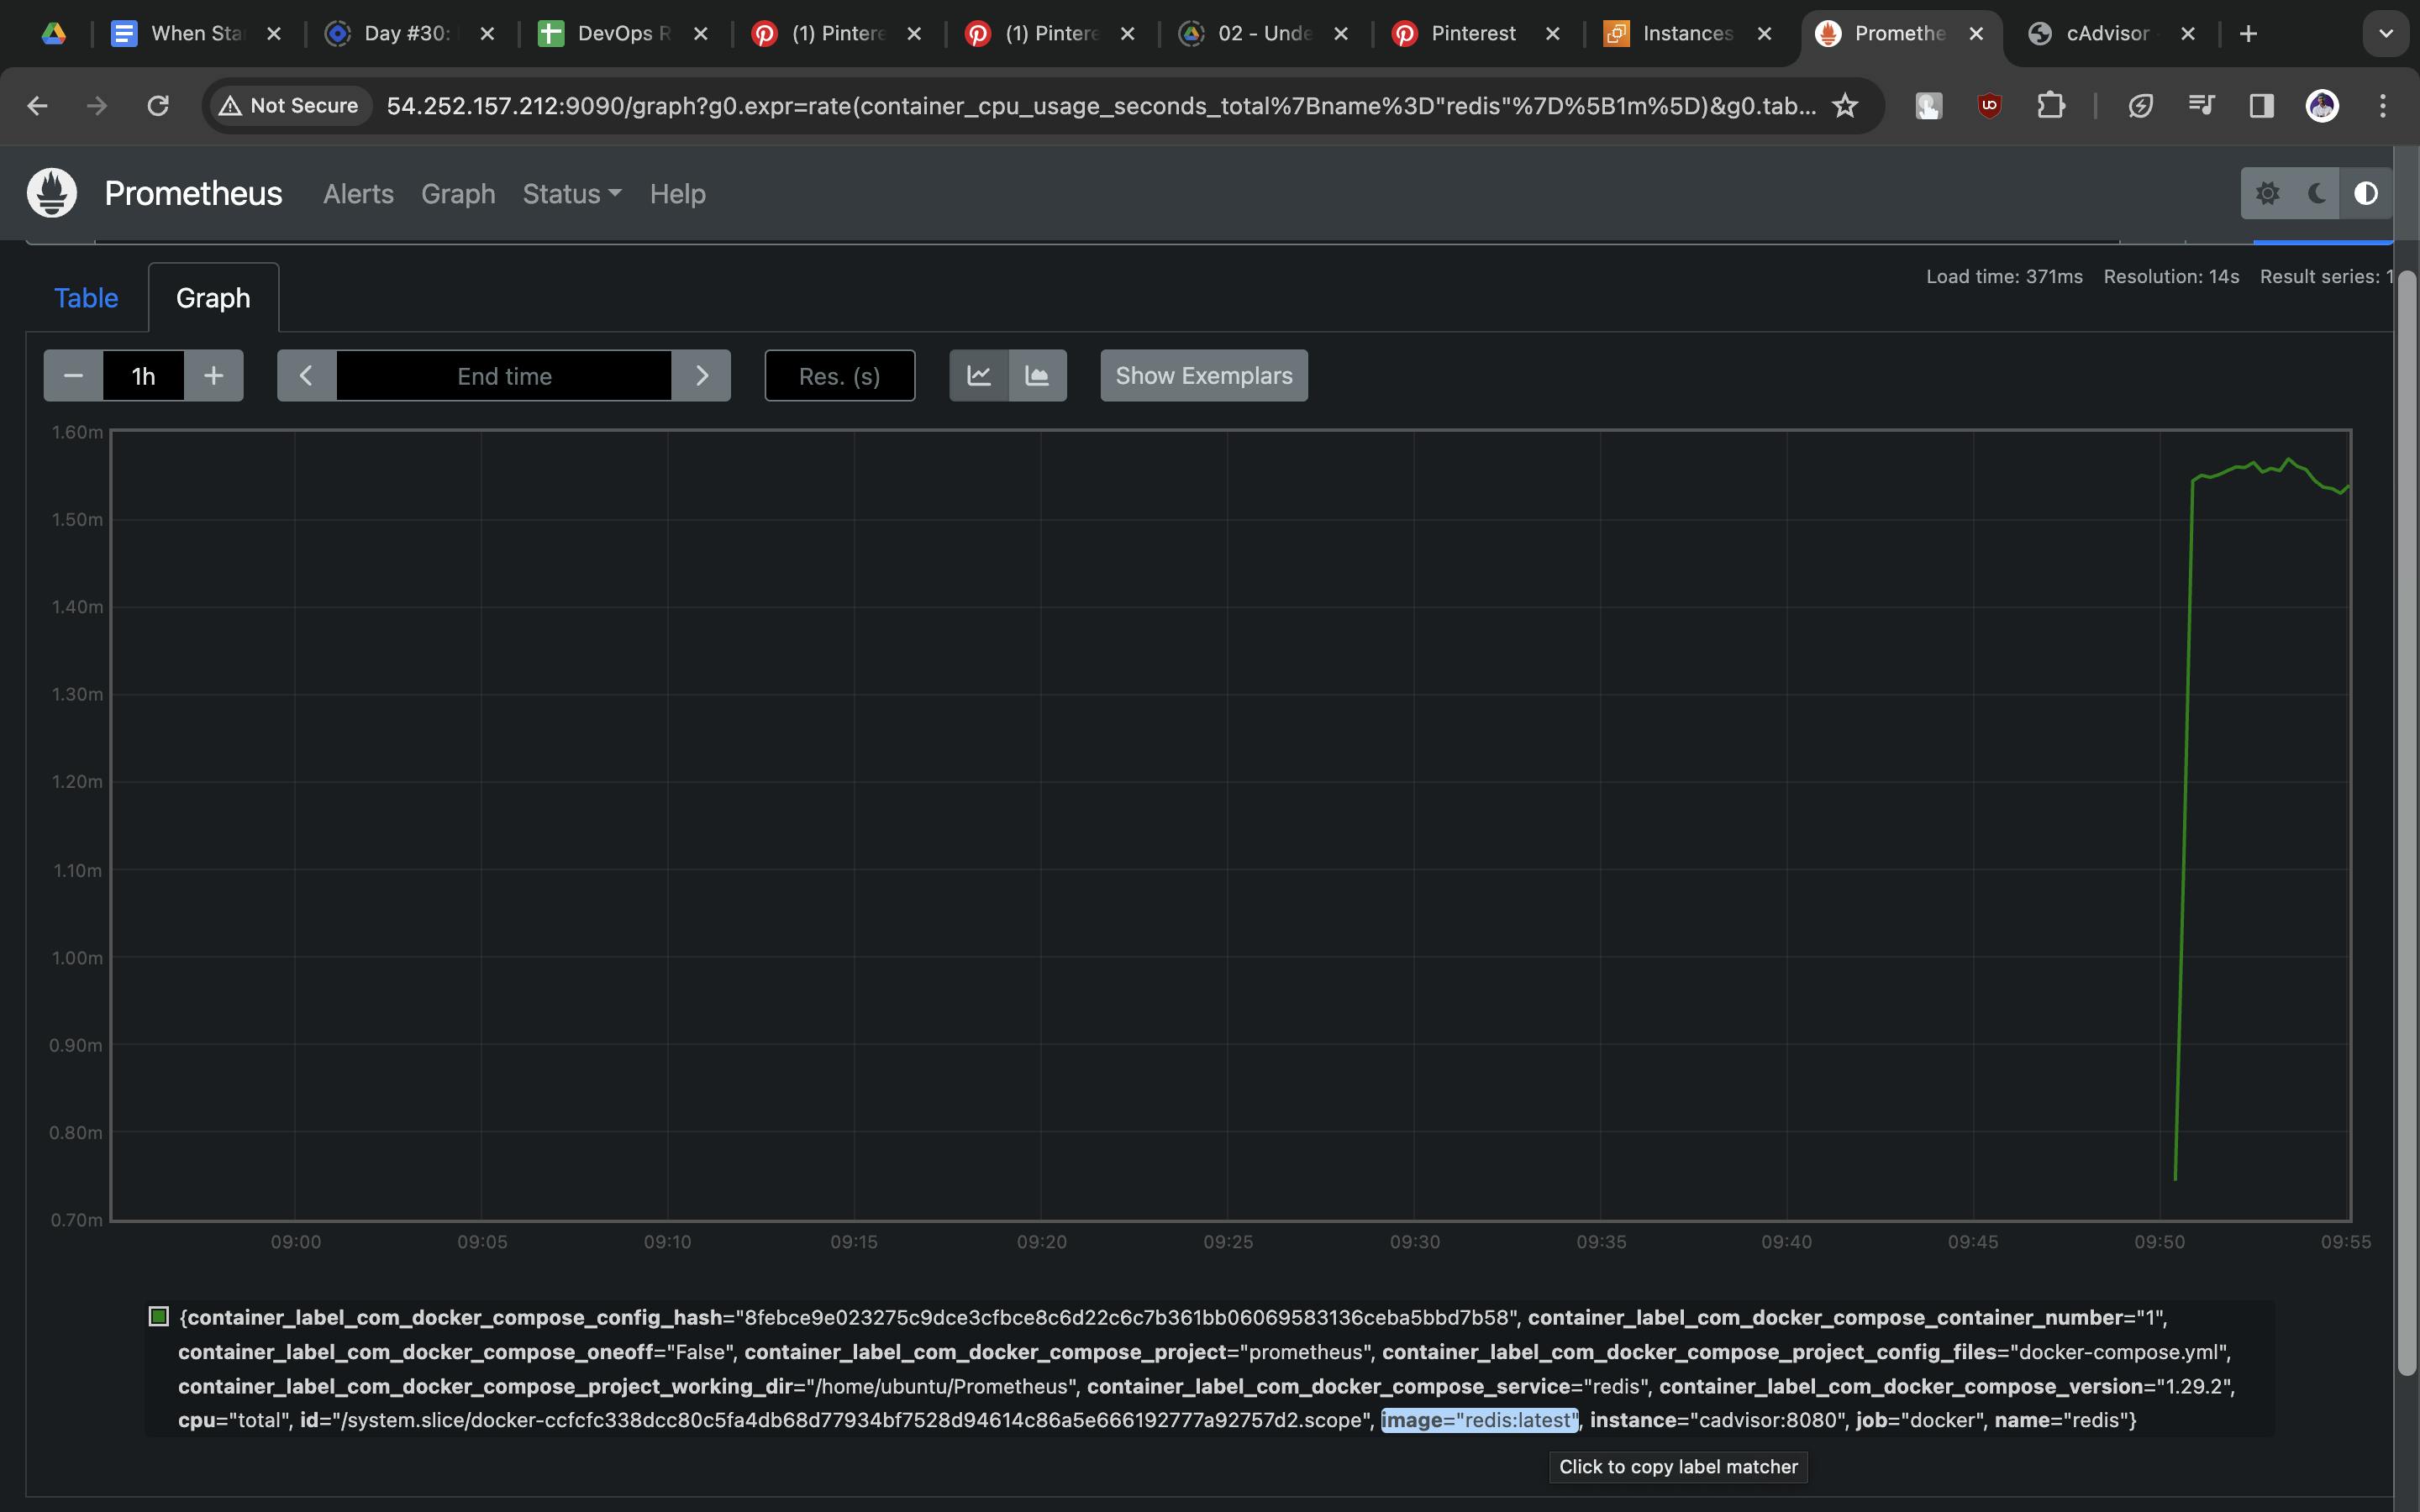
now tap on graph besides the table tab to see the graph view of the redis
Step 6: Deploy a Sample App
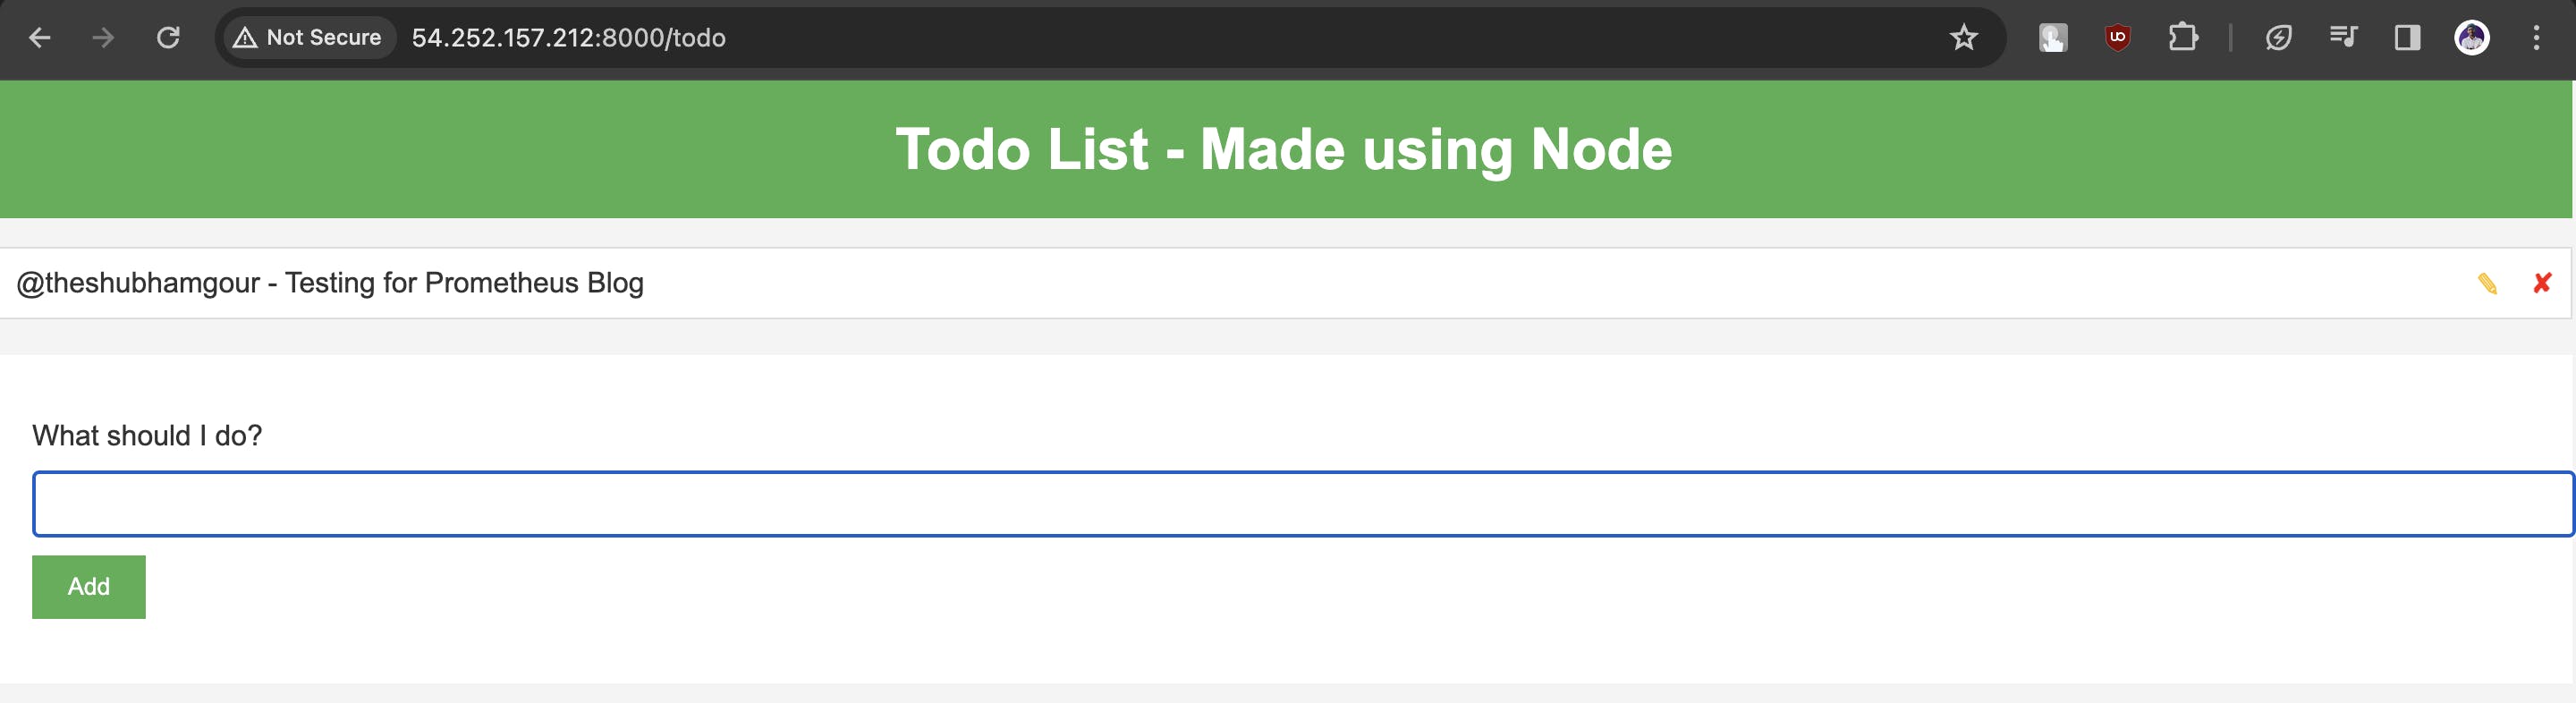
Now let's run a todo app to demostrate prometheus we already have the todo-node-app images ready in dockerhub which we will use here
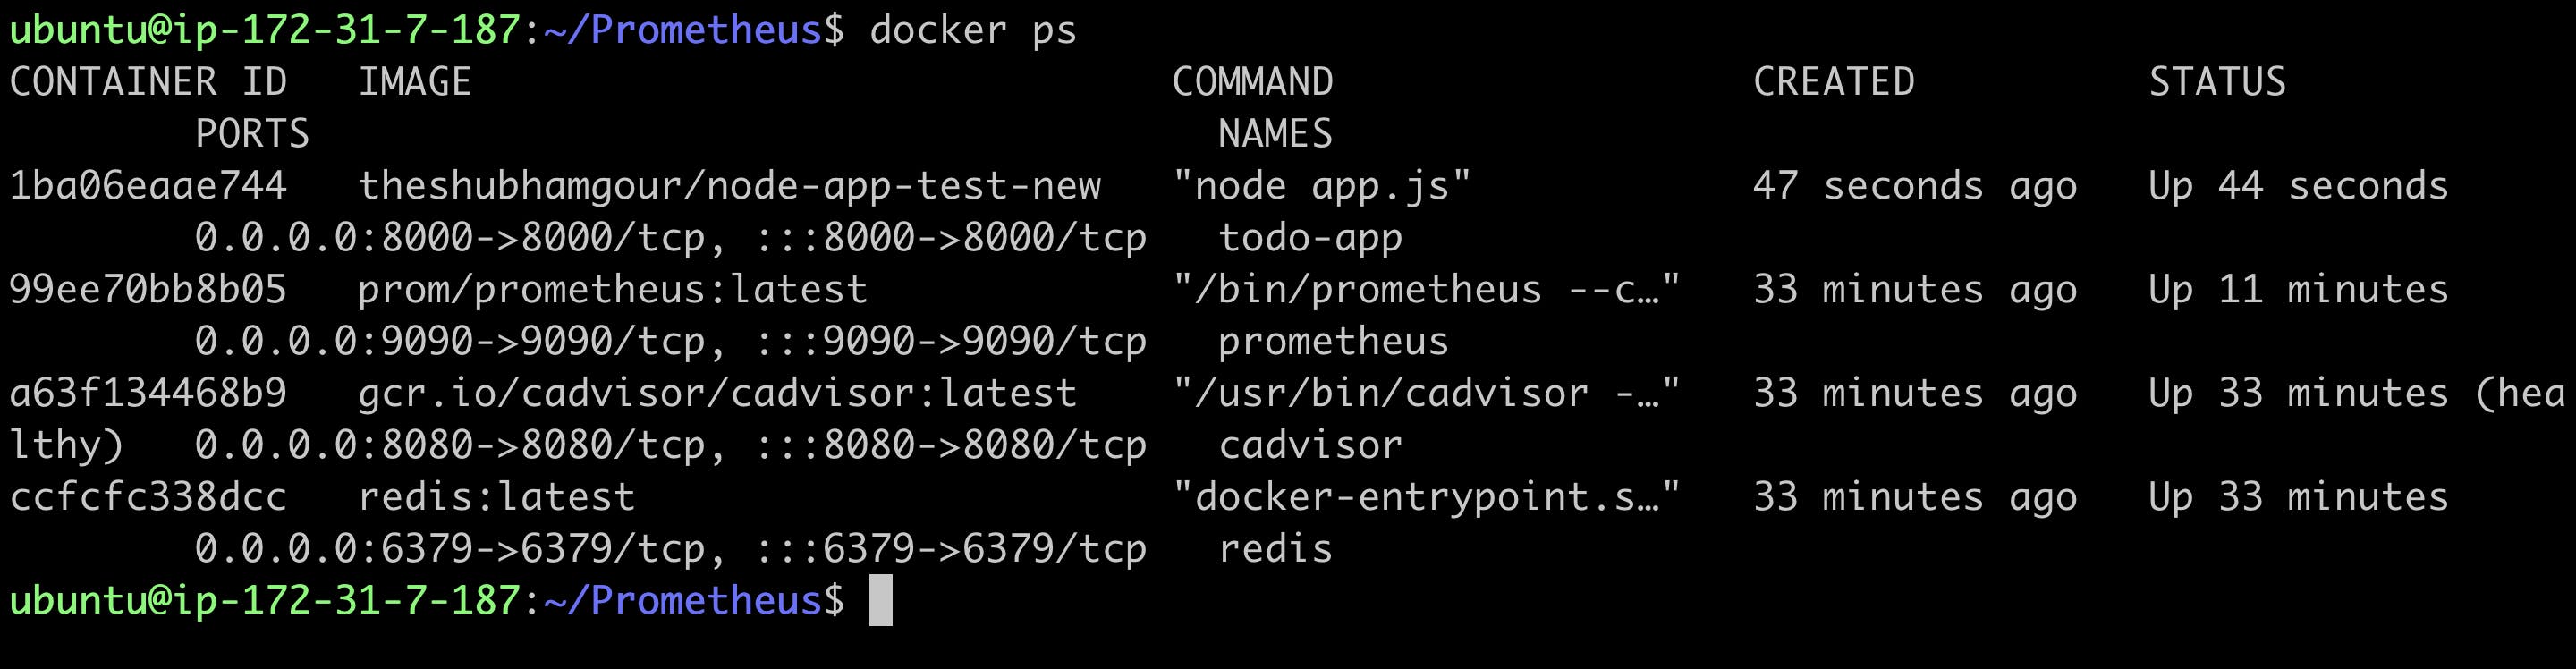
docker run -d -p 8000:8000 --name todo-app theshubhamgour/node-app-test-new
This app runs on port 8000 so make sure you are exposing the port 8000 in security groups on AWS
Here to validate execute docker ps to check the status of the container
Now goto the browser and check the application it should be up and running
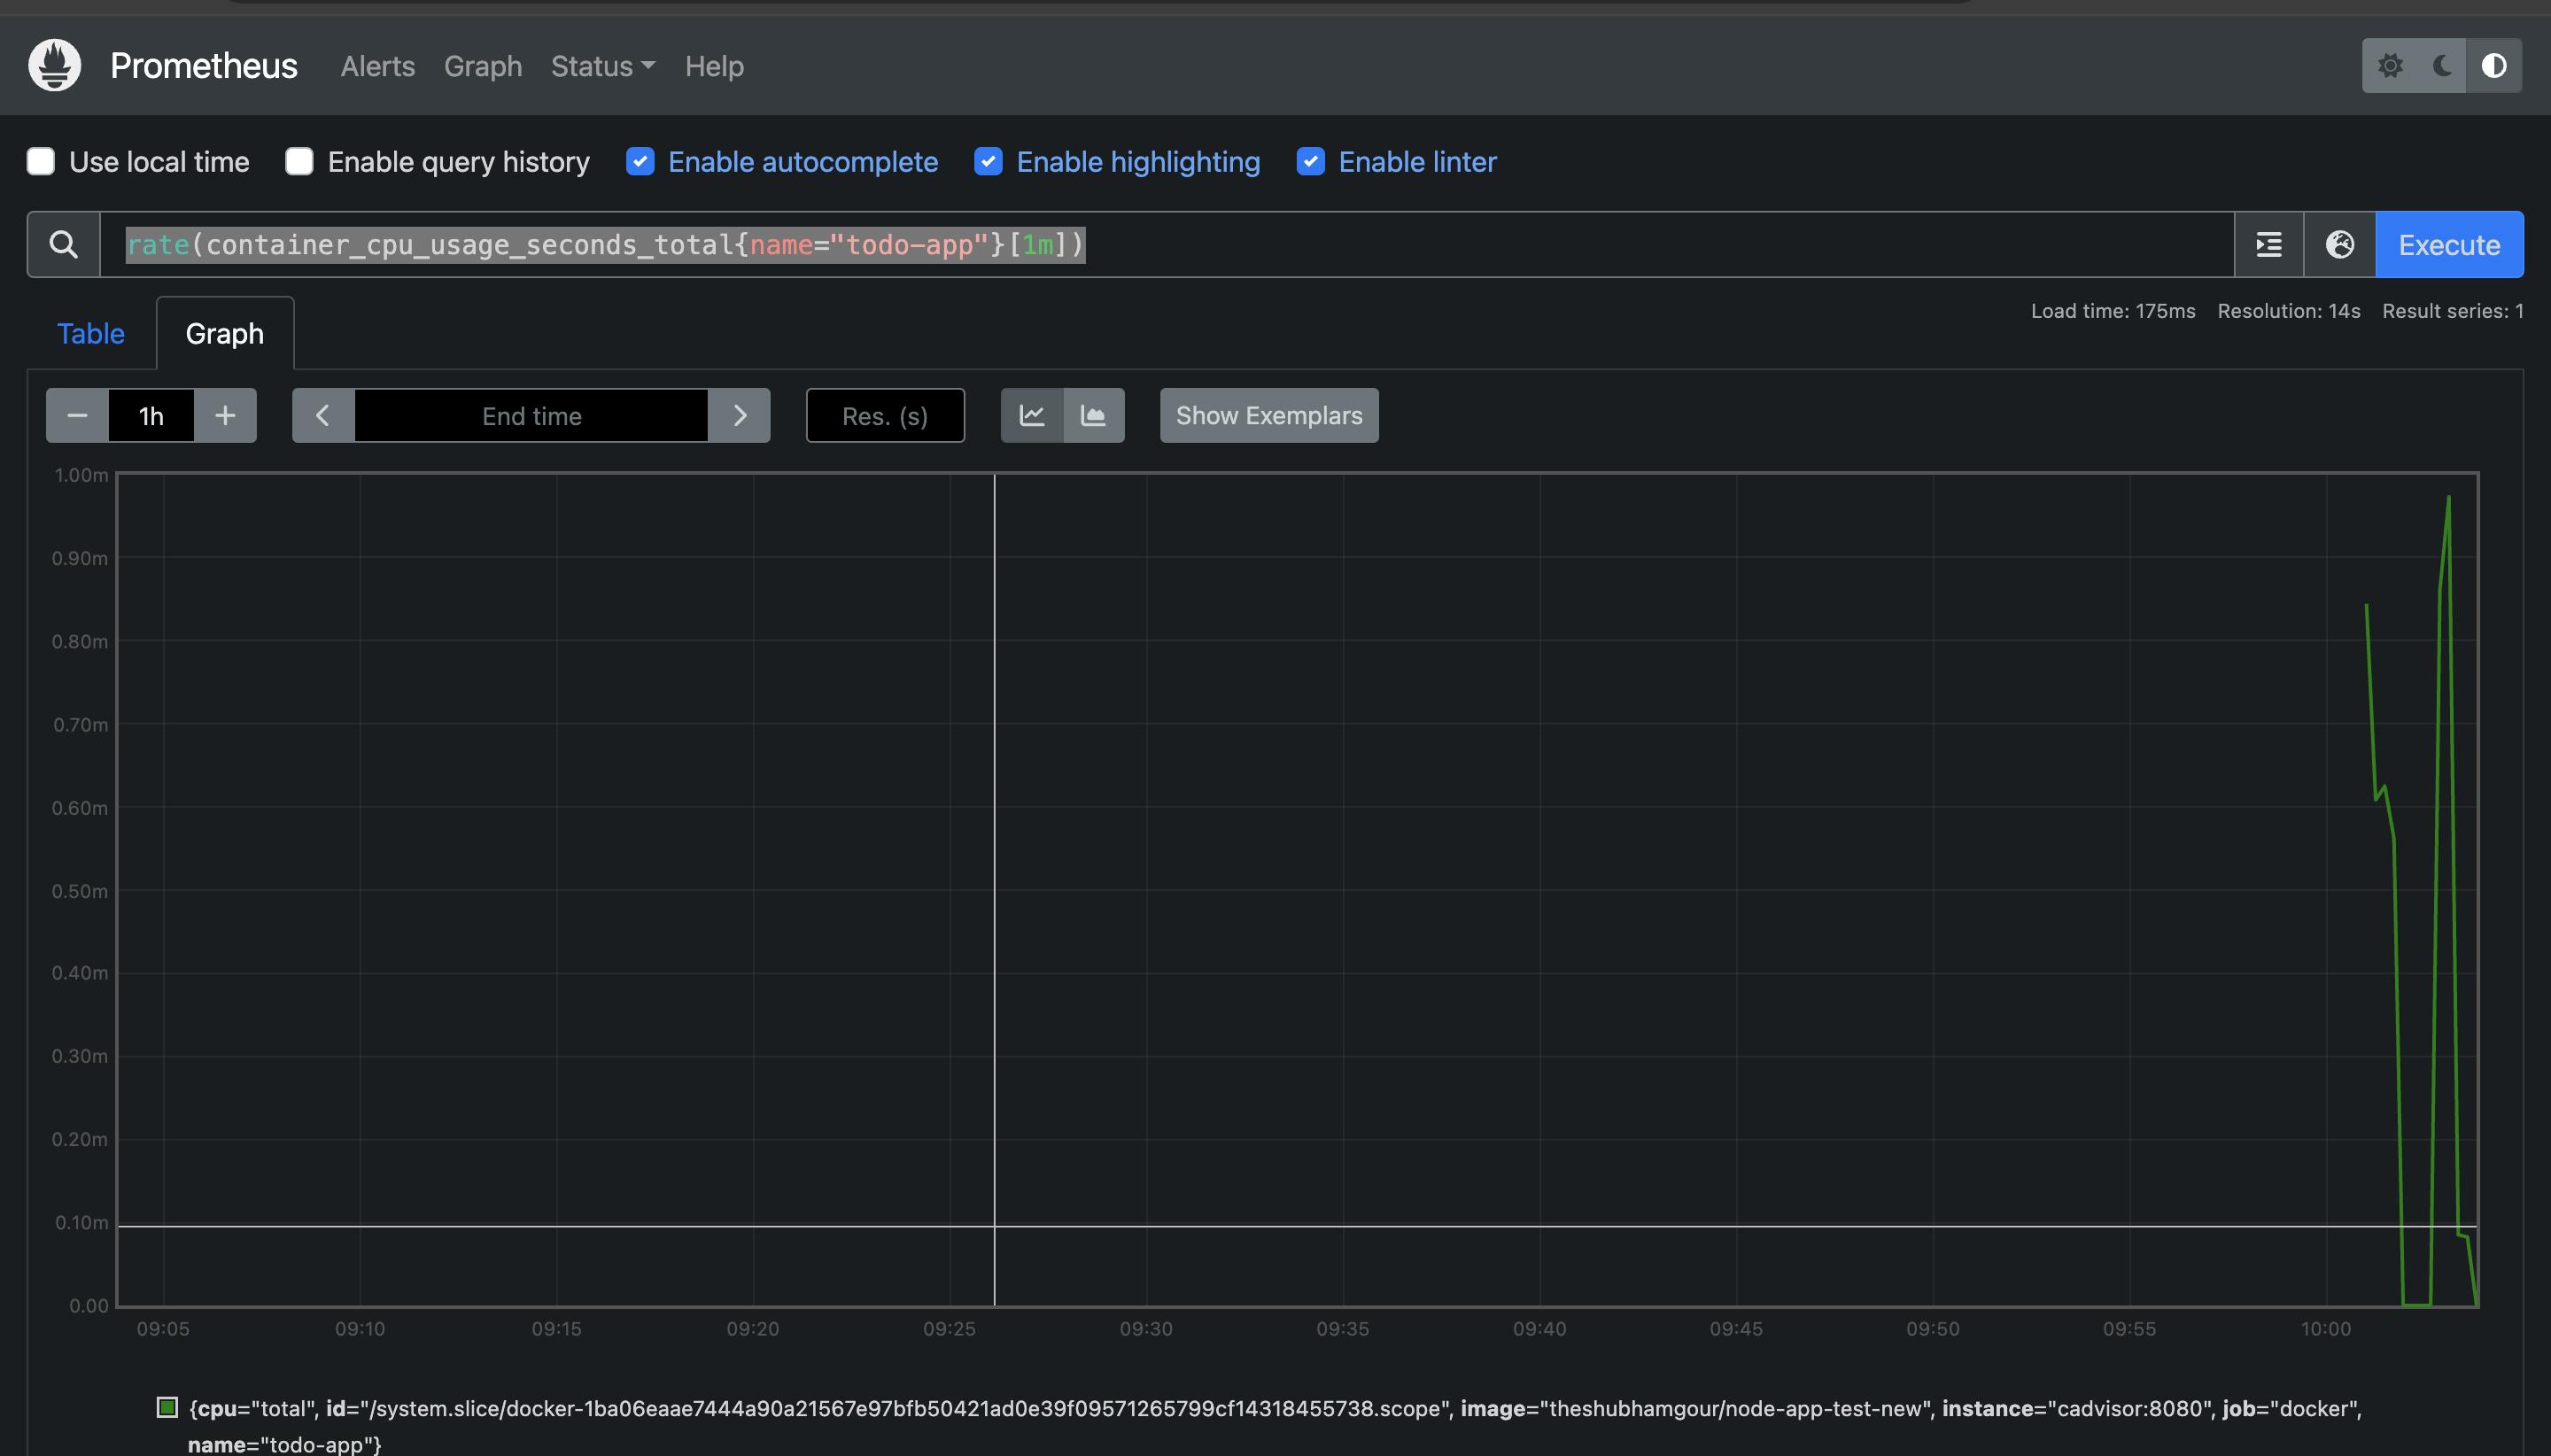
Now goto prometheus dashboard and execute the below Promql to validate the change for todo-app
rate(container_cpu_usage_seconds_total{name="todo-app"}[1m])
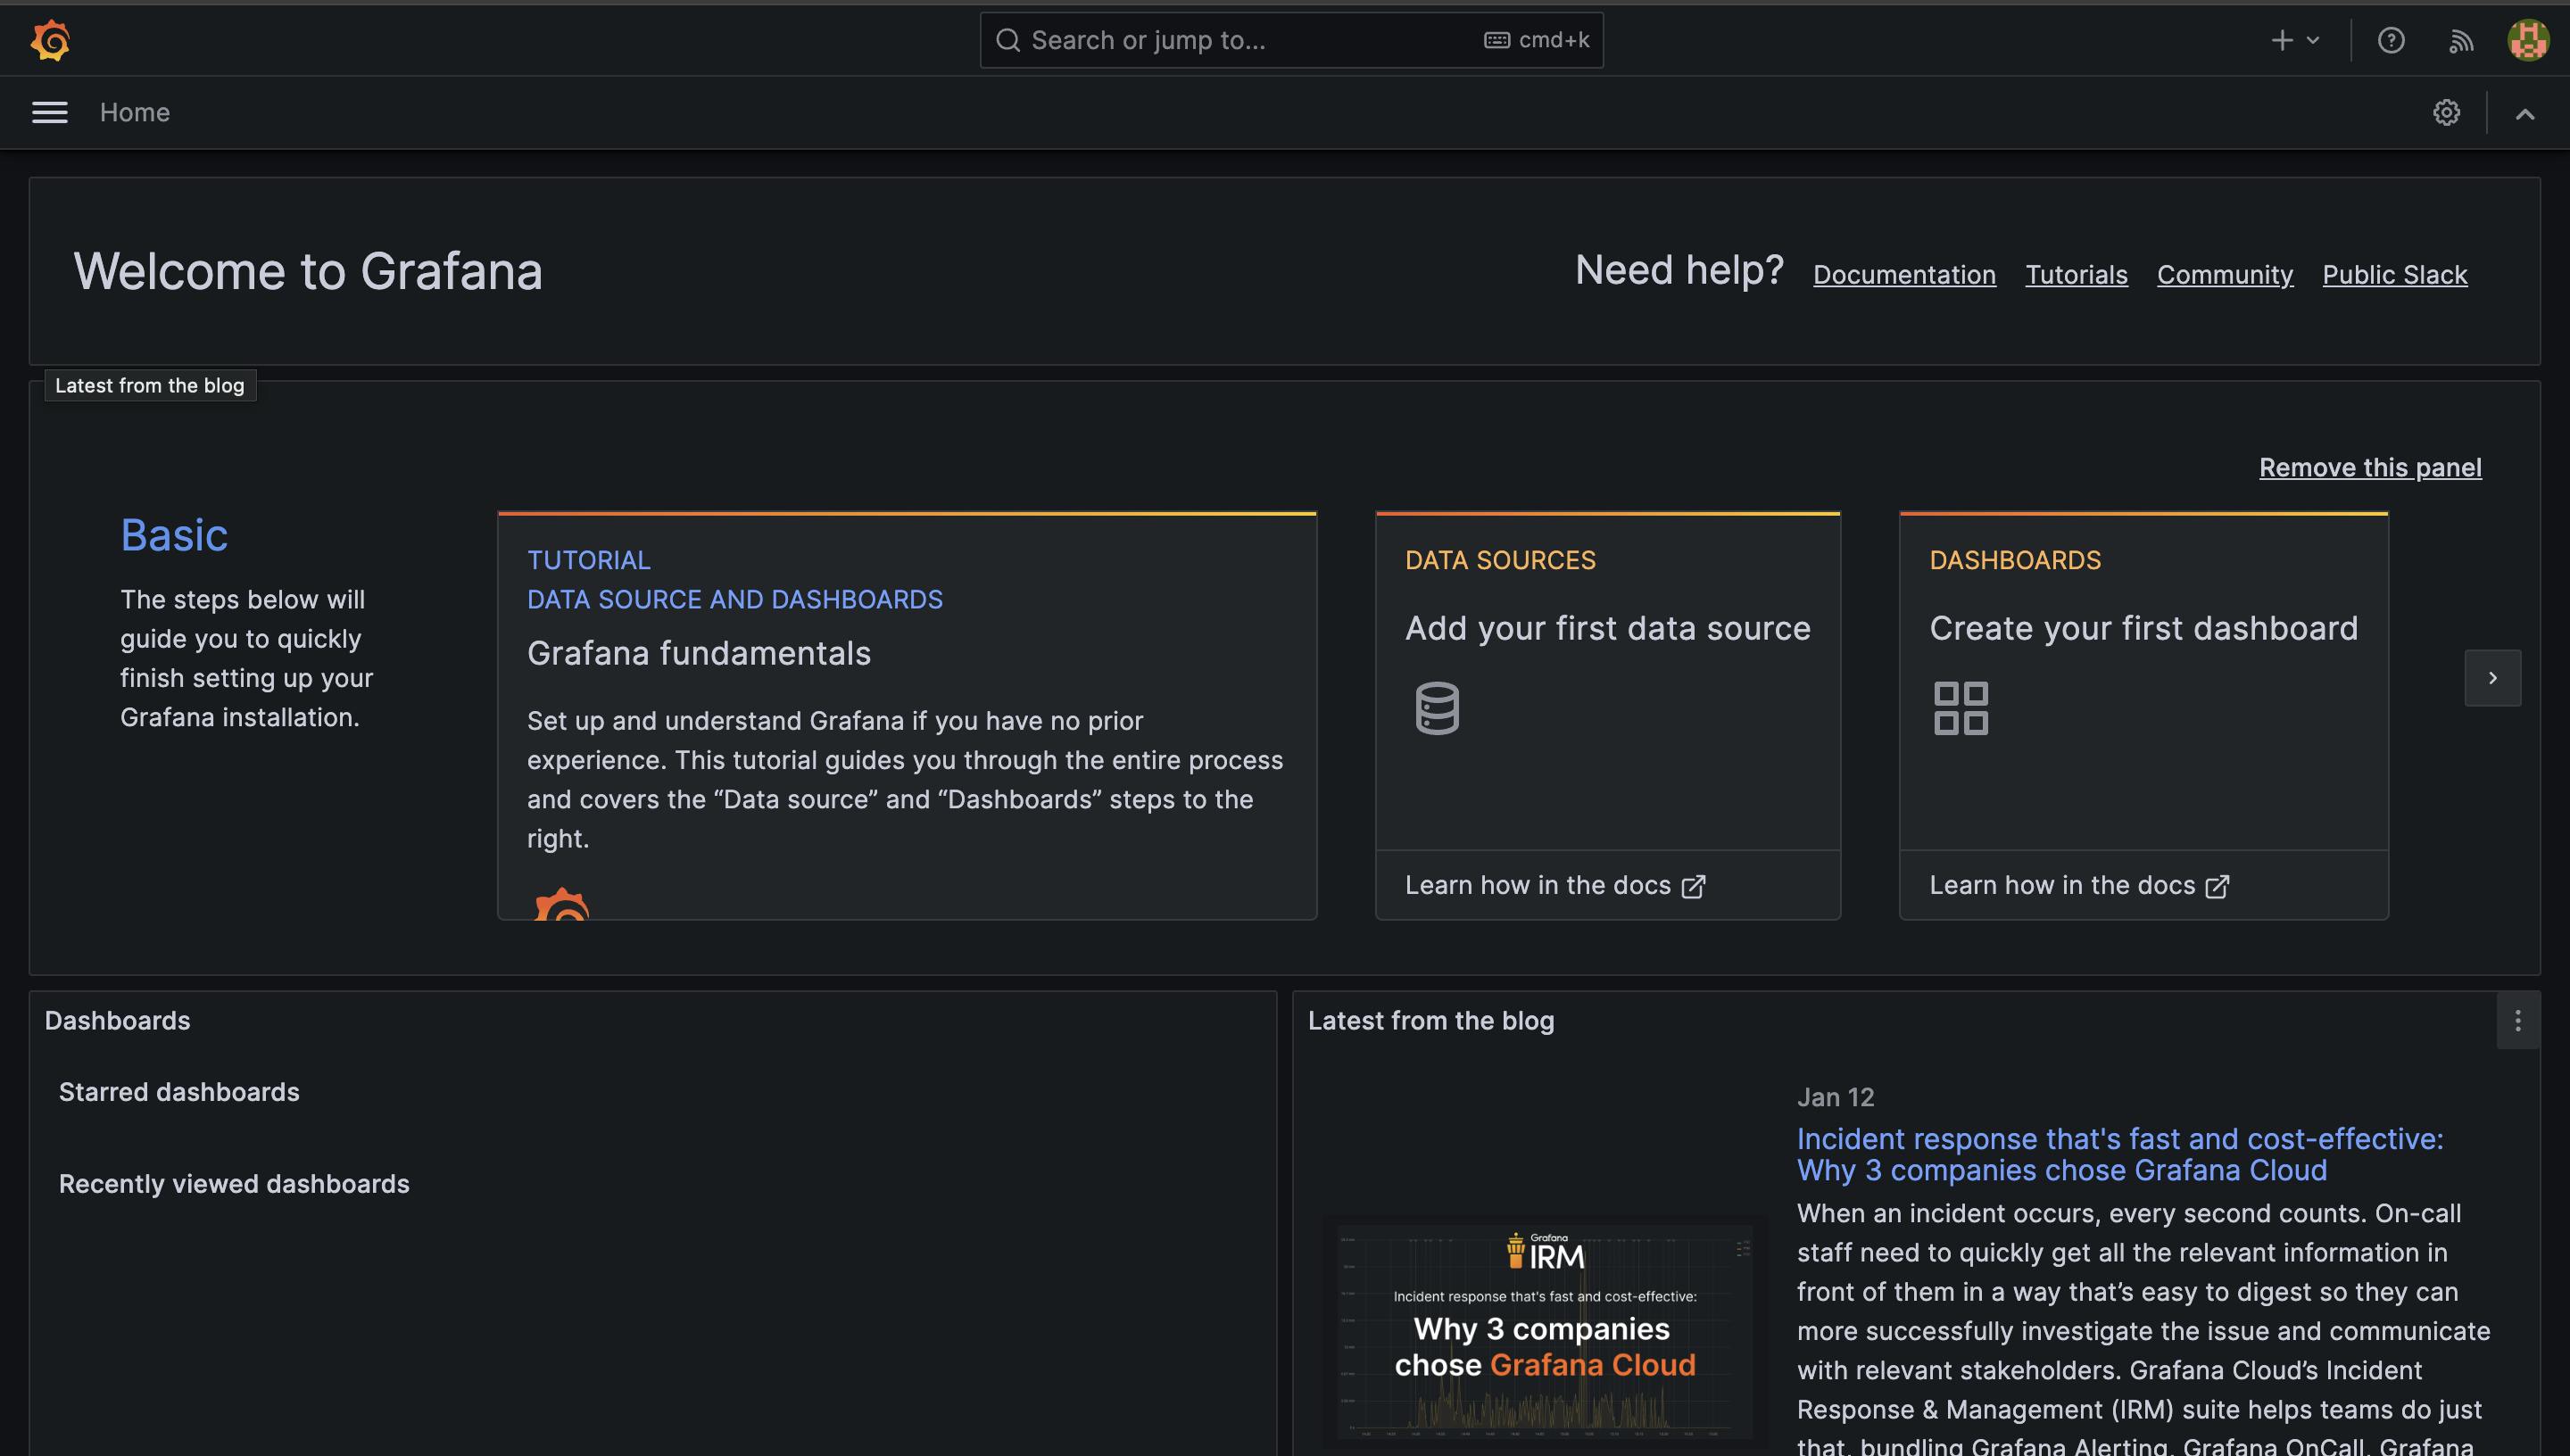
Step 7: Grafana Integration
Install Grafana and set it up to visualize metrics. Access Grafana on port 3000, add Prometheus as a data source, and explore Grafana Labs for a Docker dashboard template.
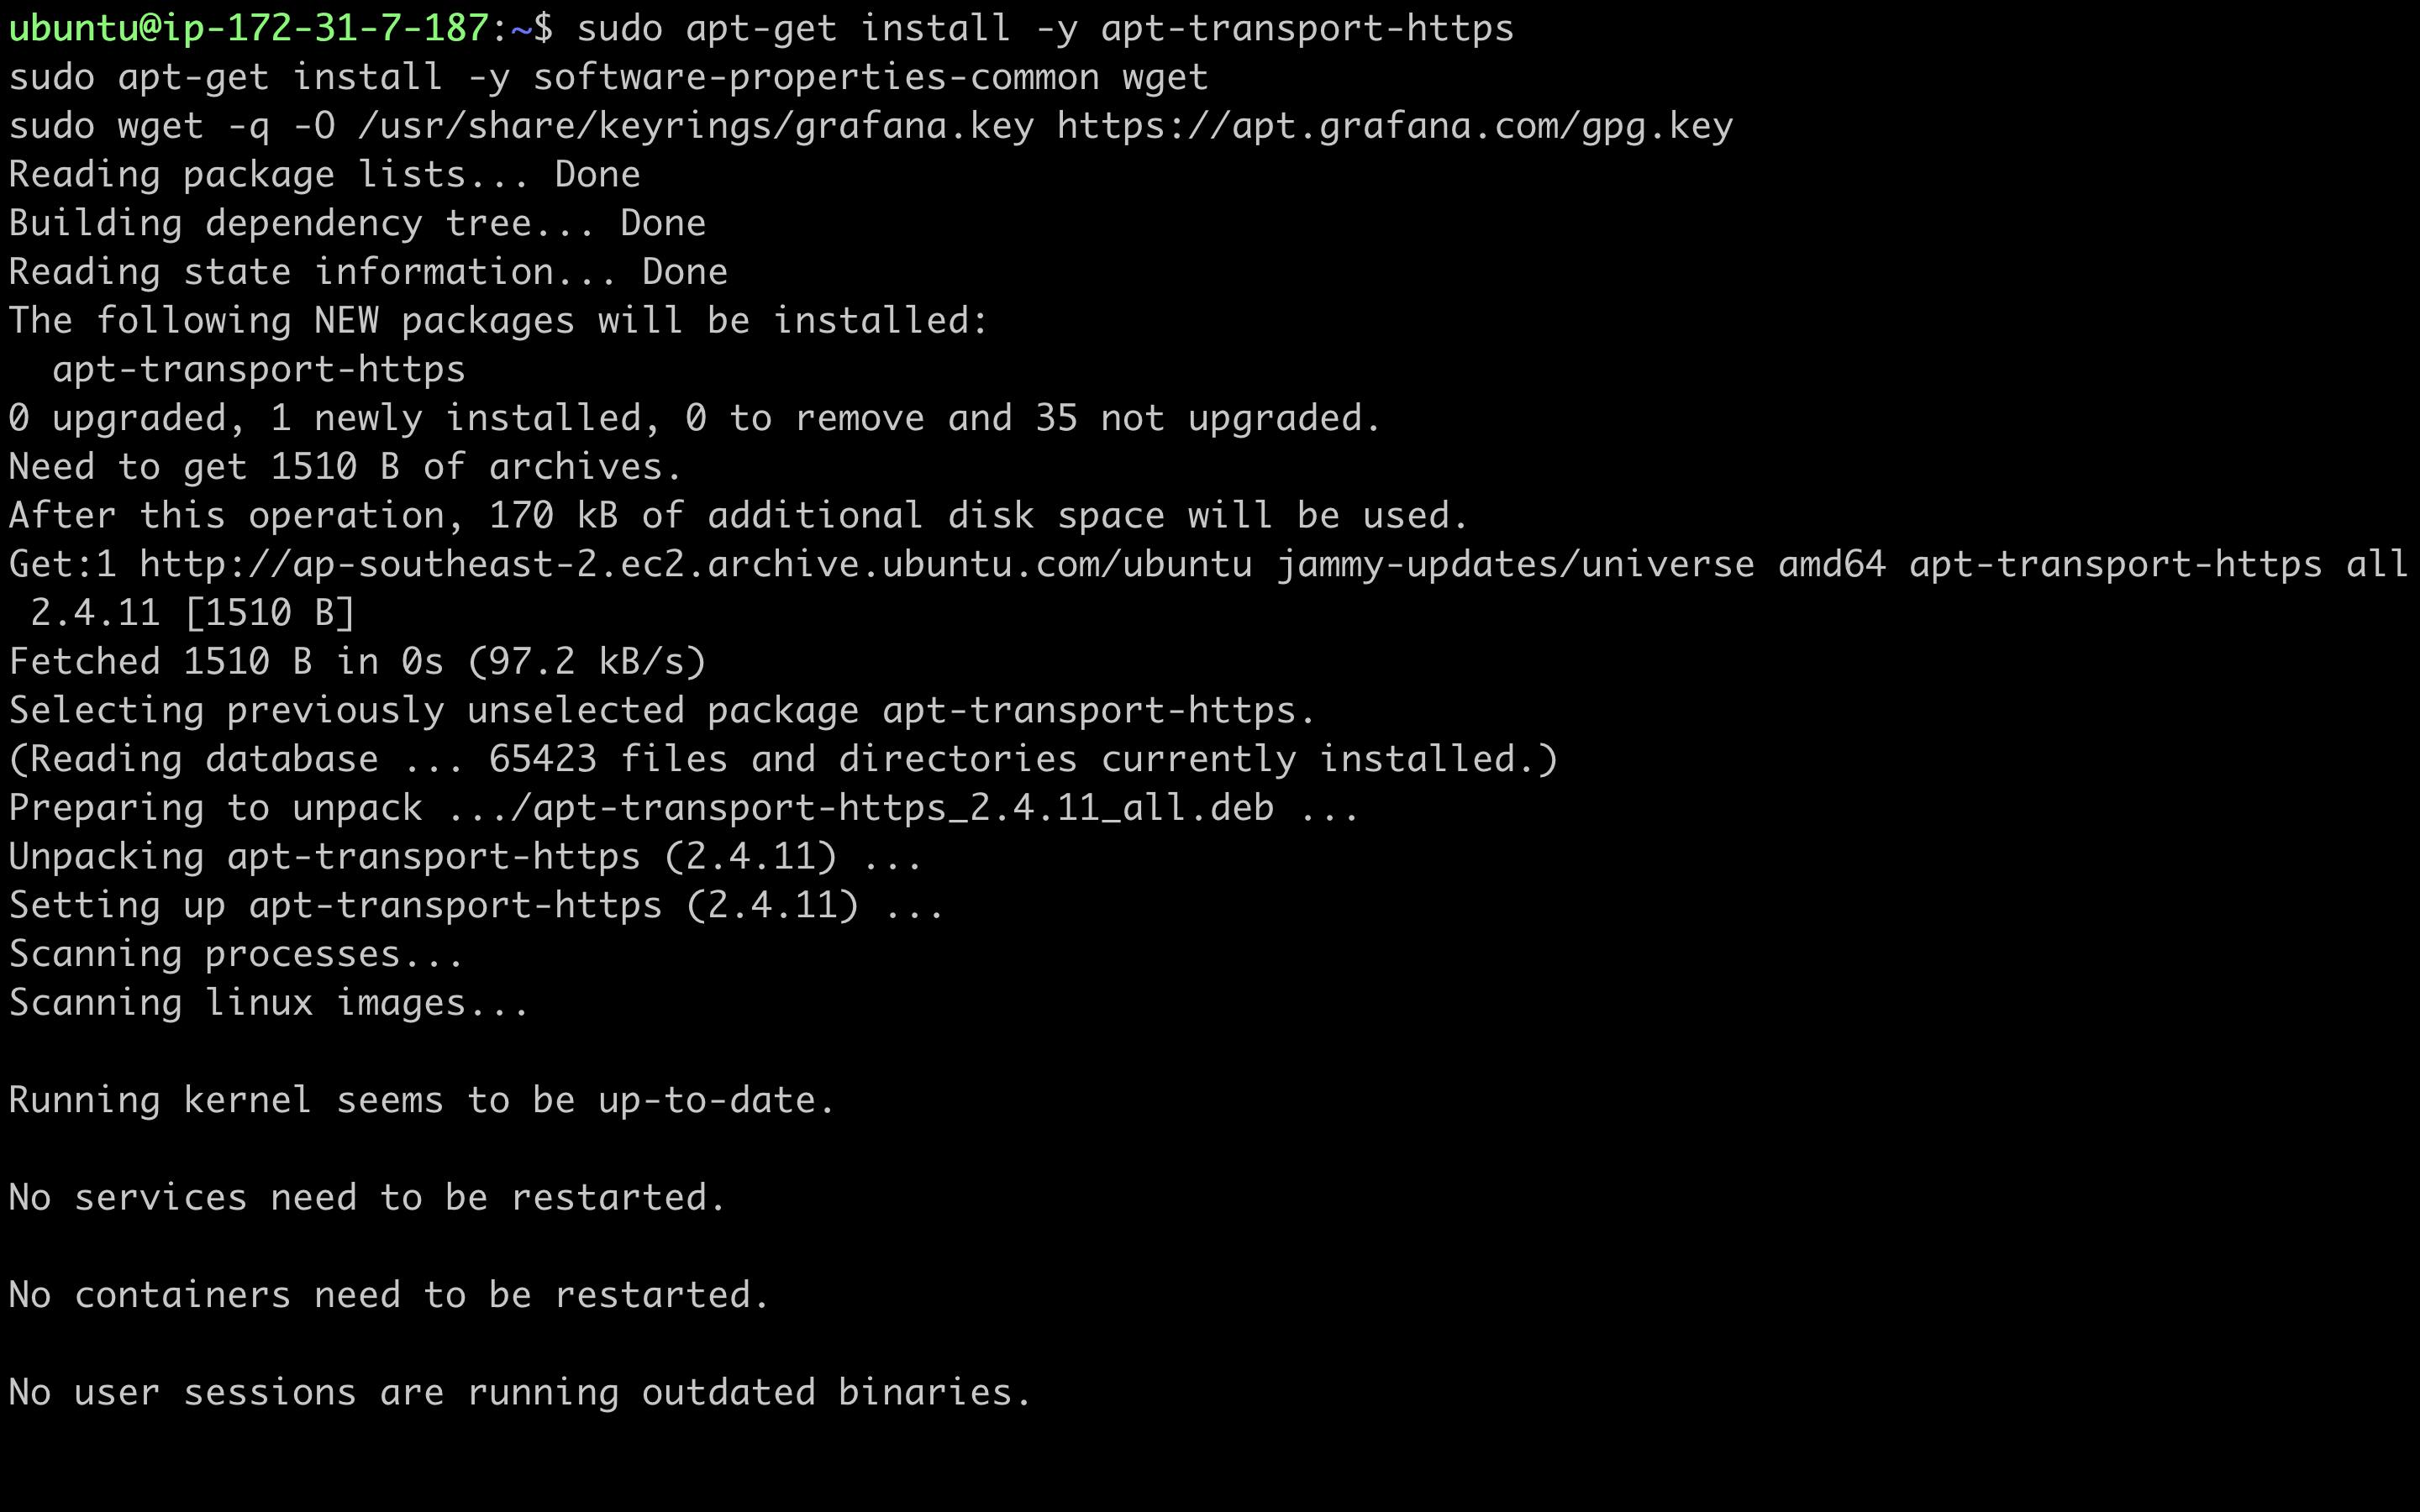
sudo apt-get install -y apt-transport-https
sudo apt-get install -y software-properties-common wget
sudo wget -q -O /usr/share/keyrings/grafana.key https://apt.grafana.com/gpg.key
Add the stable key
echo "deb [signed-by=/usr/share/keyrings/grafana.key] https://apt.grafana.com stable main" | sudo tee -a /etc/apt/sources.list.d/grafana.list
Update the list of available packages
sudo apt-get update
Install the latest OSS release:
sudo apt-get install grafana
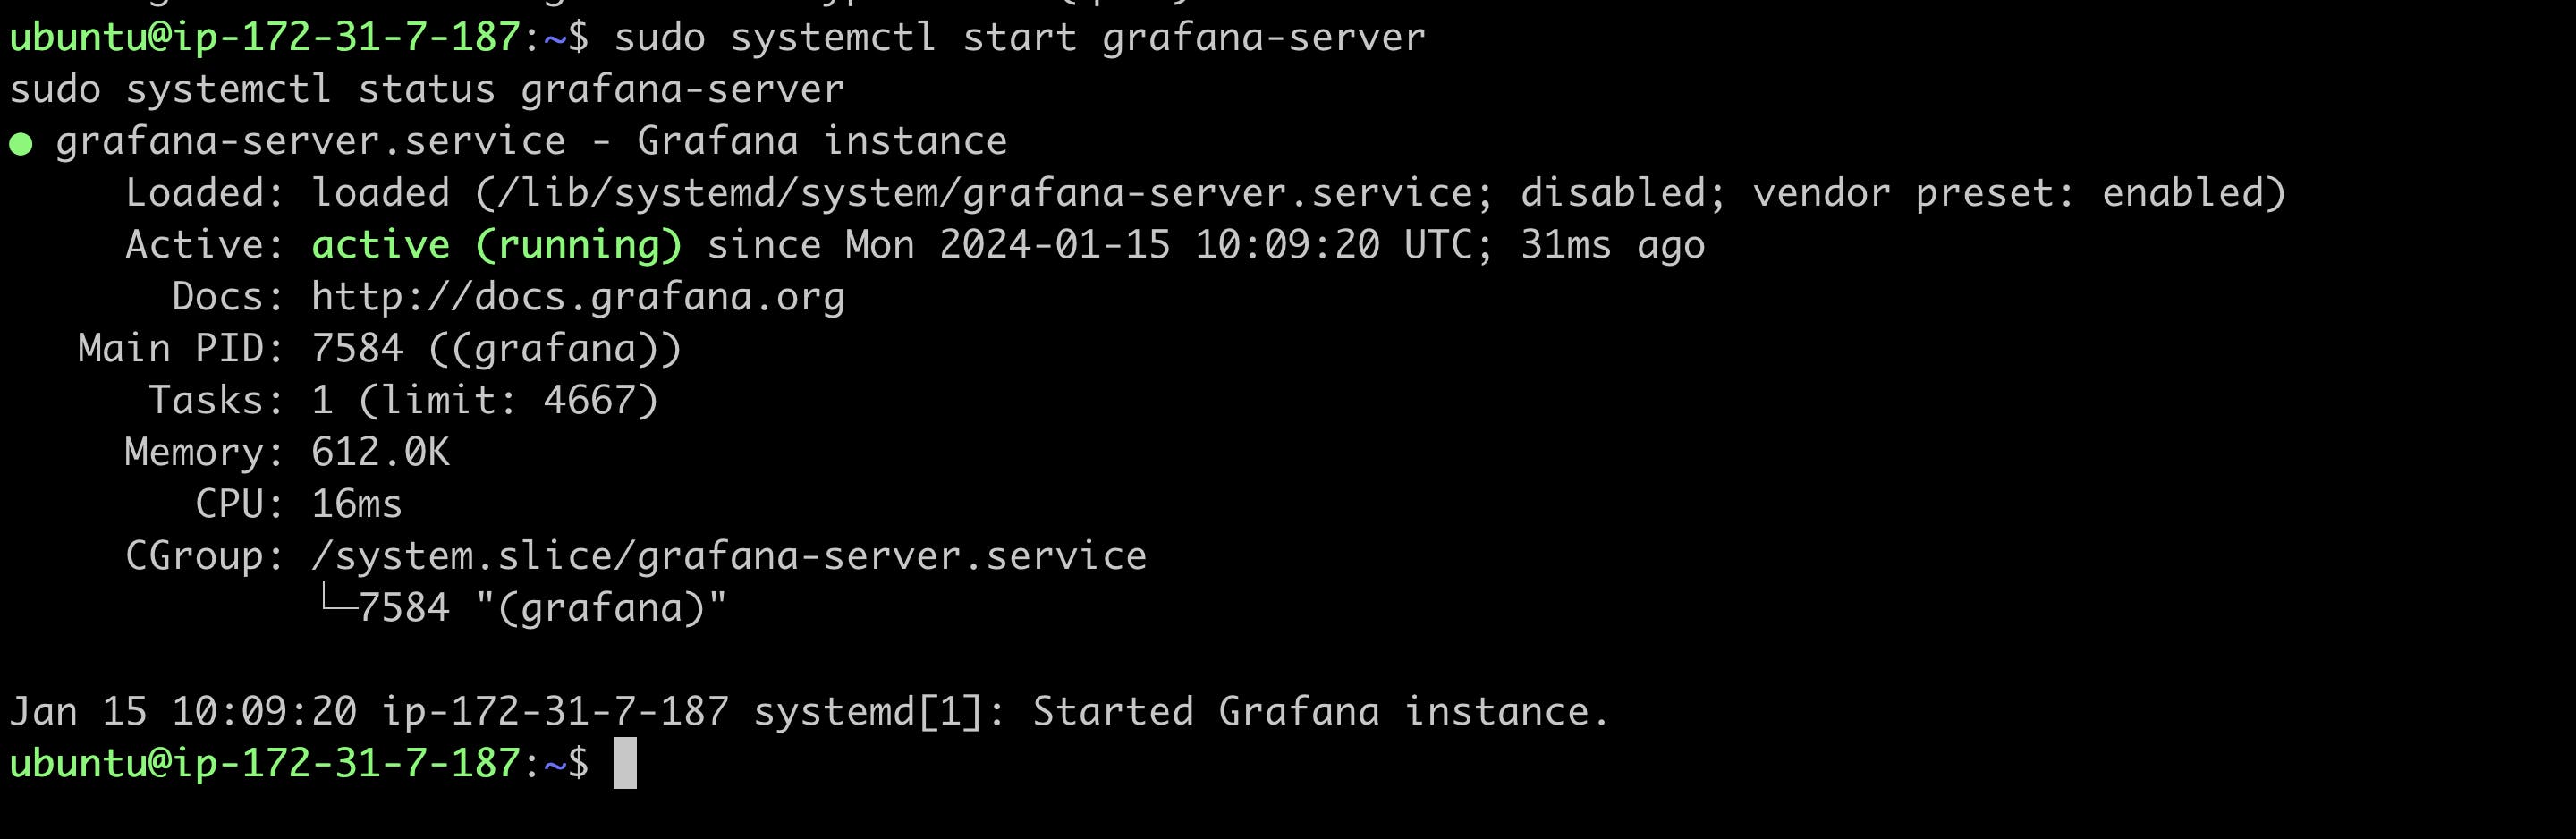
Start and enable the Grafana Server
sudo systemctl start grafana-server
sudo systemctl status grafana-server
Now enable port 3000 on security groups on AWS for accessing grafana
goto Data sources
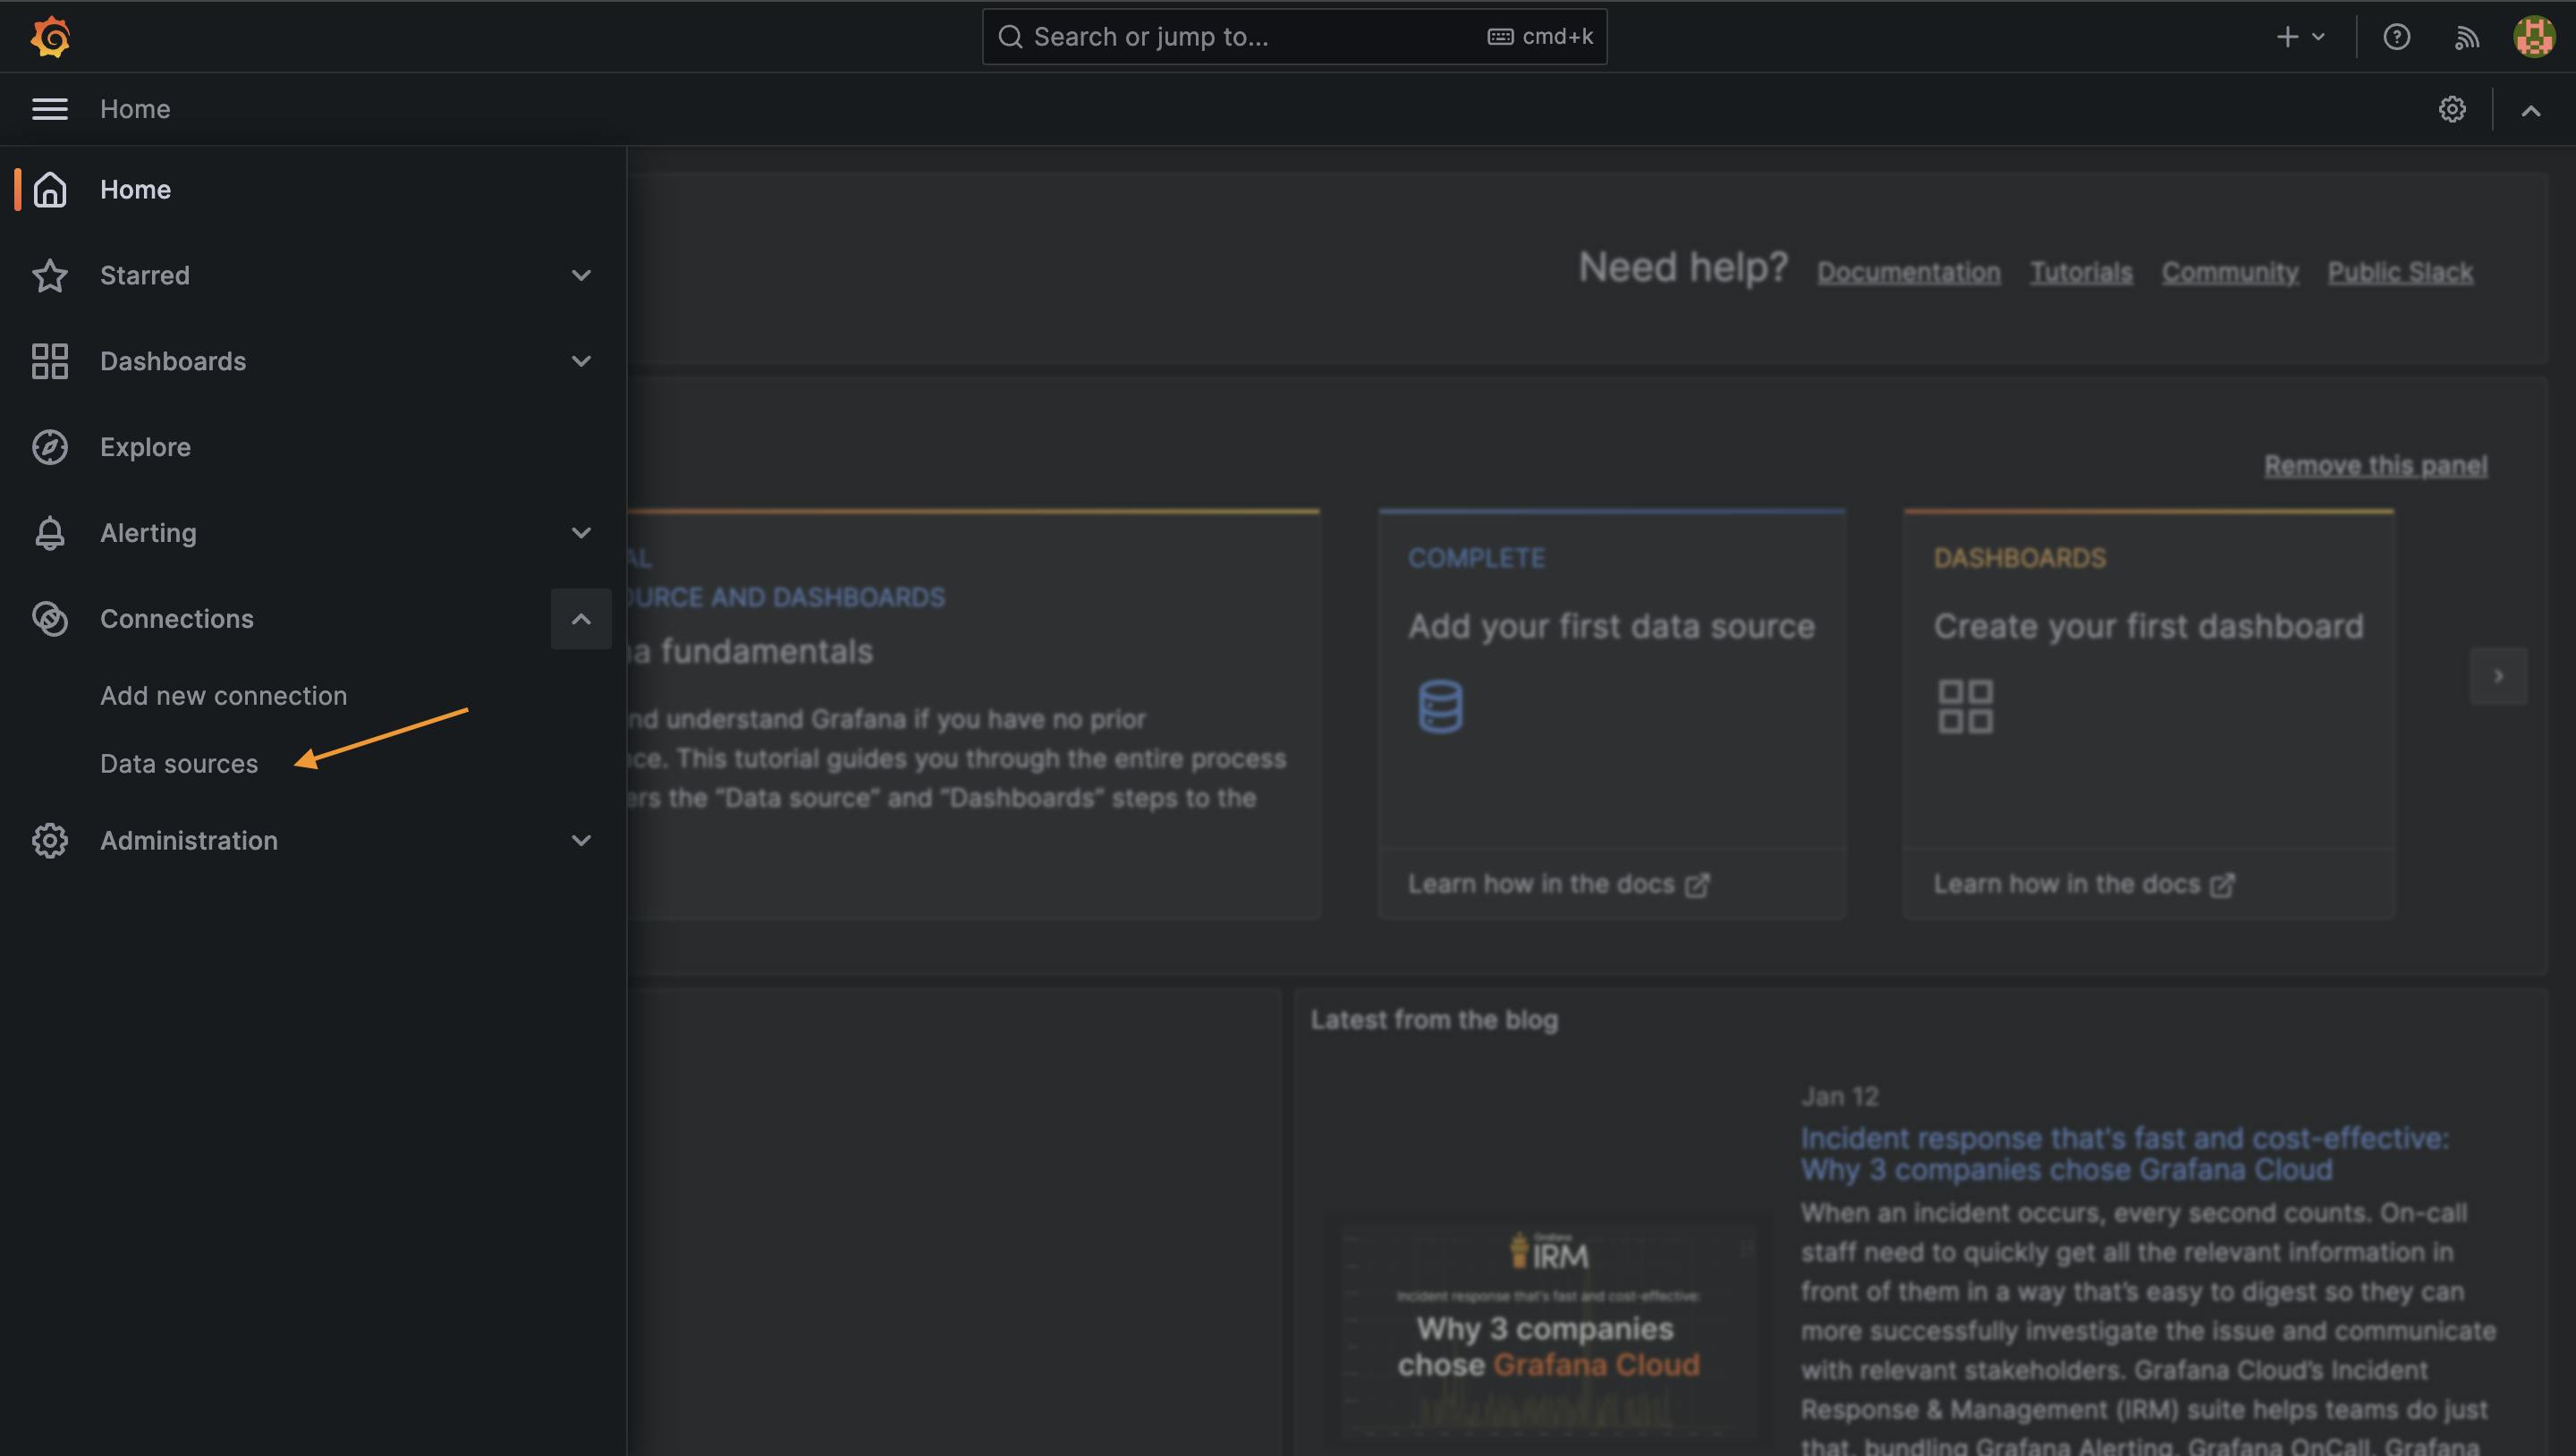
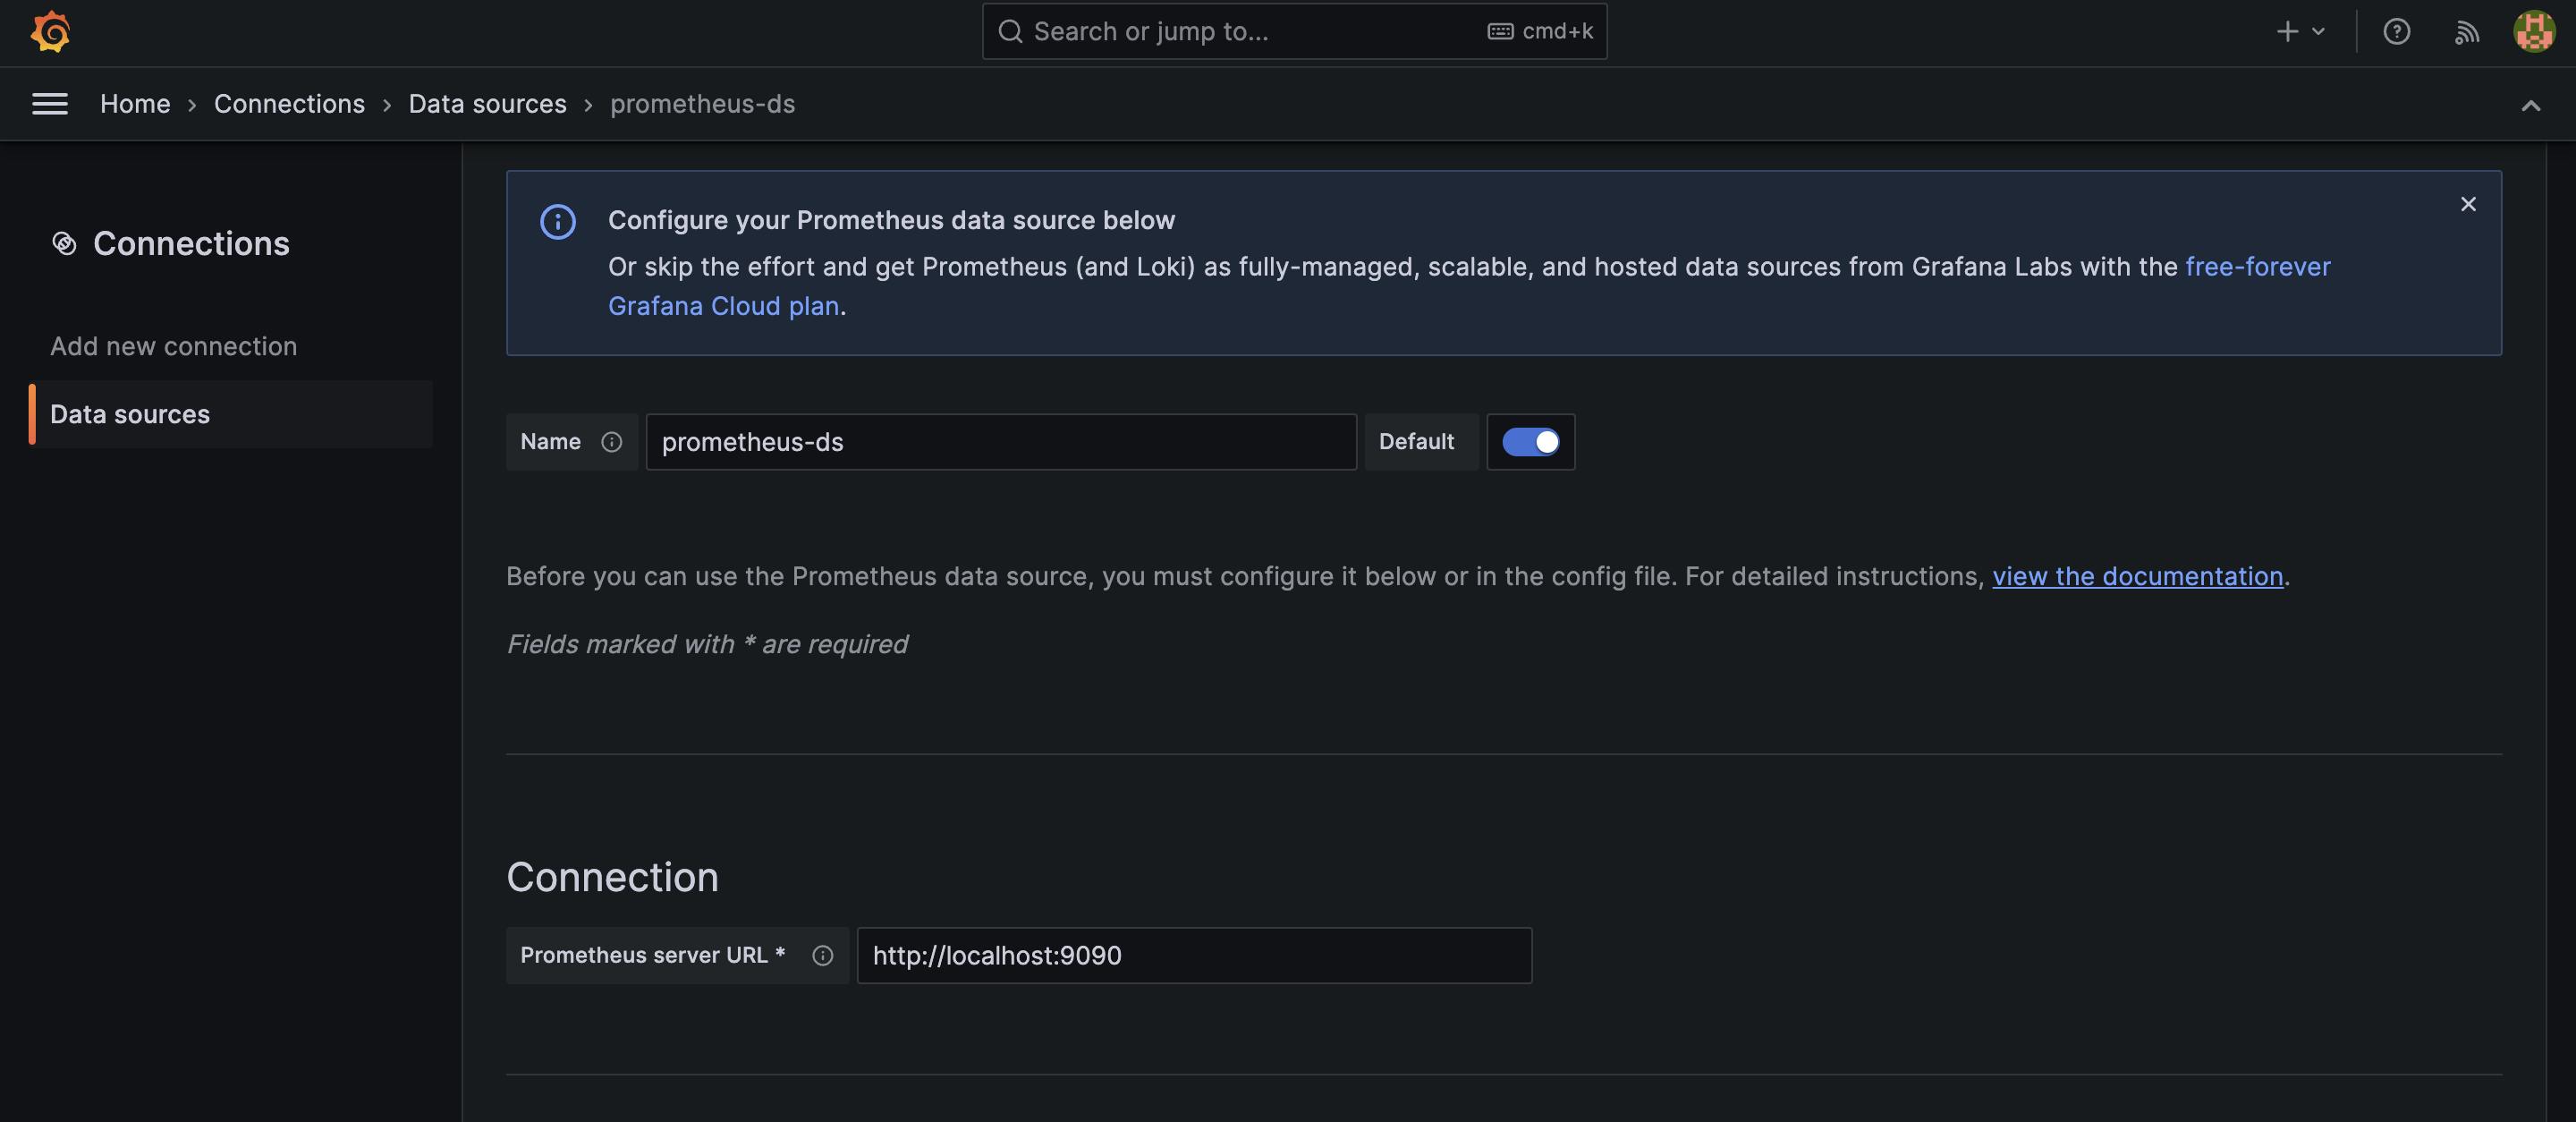
Now add prometheus as a data source in Grafana and add the name of the data sources inside Prometheus and add the connection url
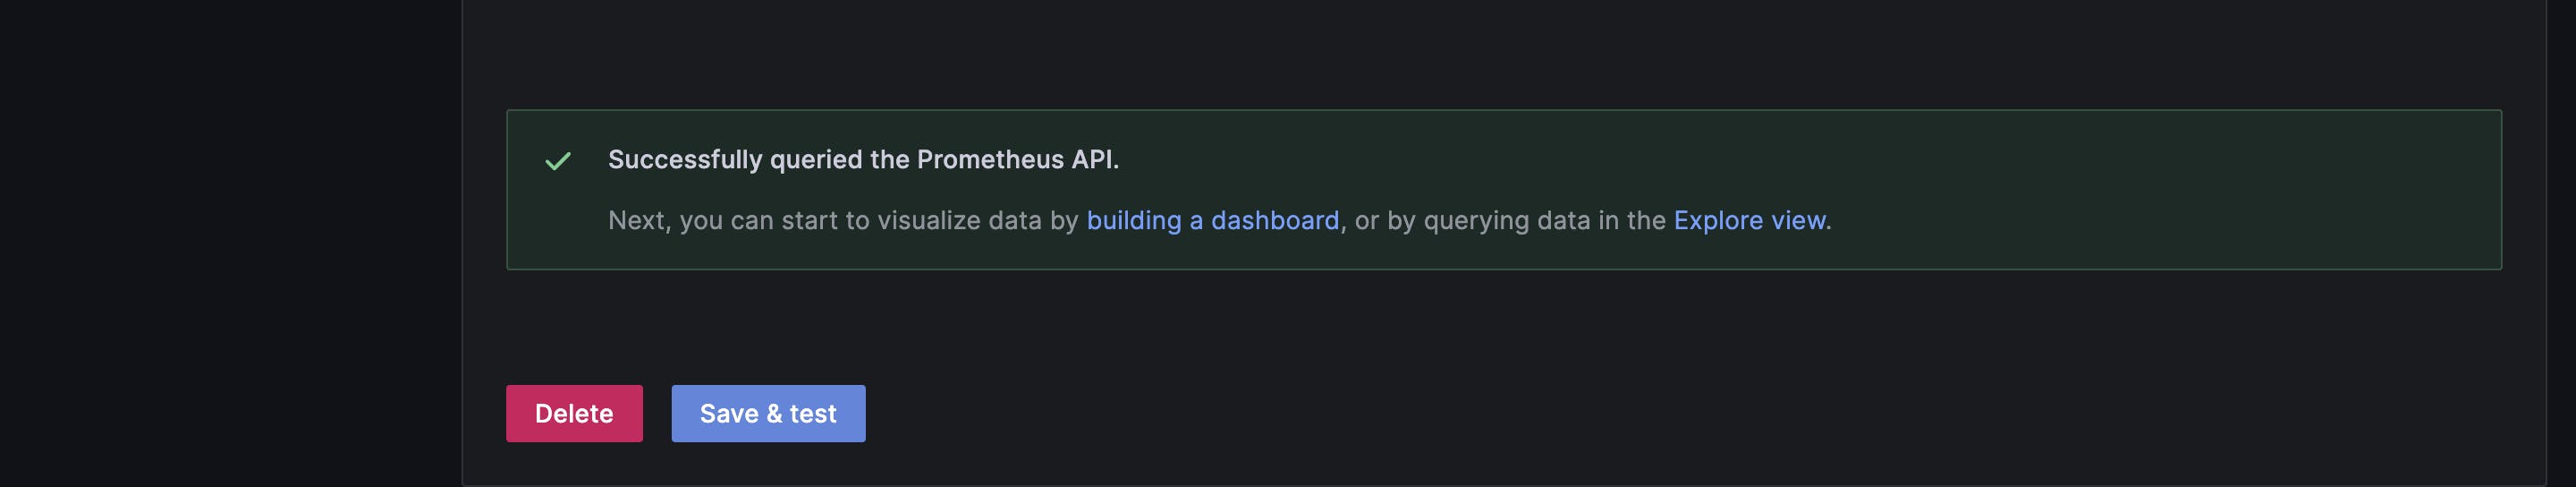
Once done tap on save and next you will get a success message
Now click on Explore view and enter the Promql to check the graph
sum(container_network_receive_bytes_total{name="todo-app"})
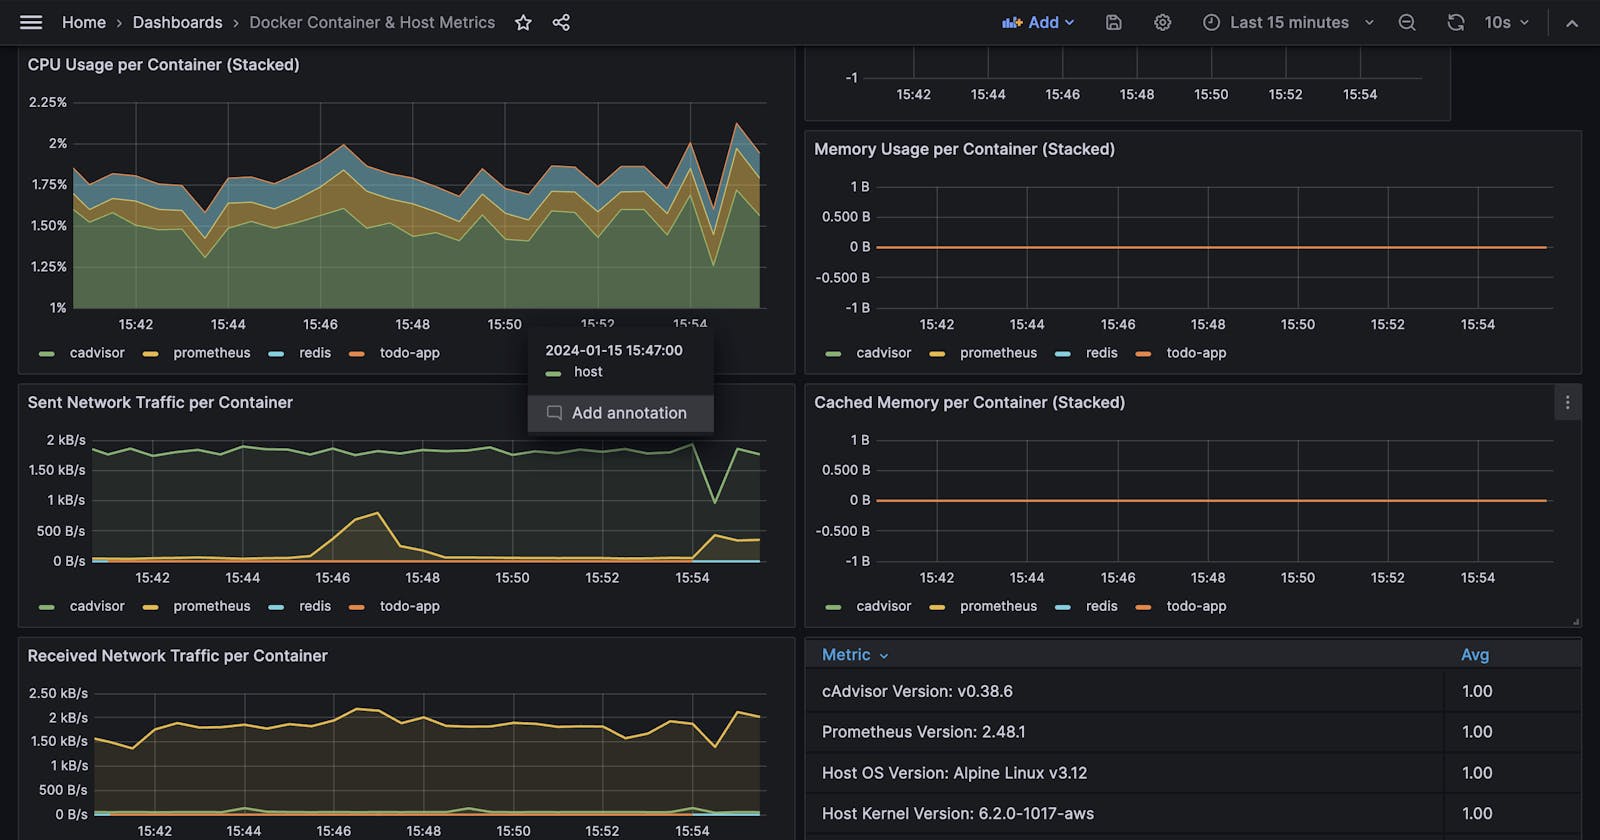
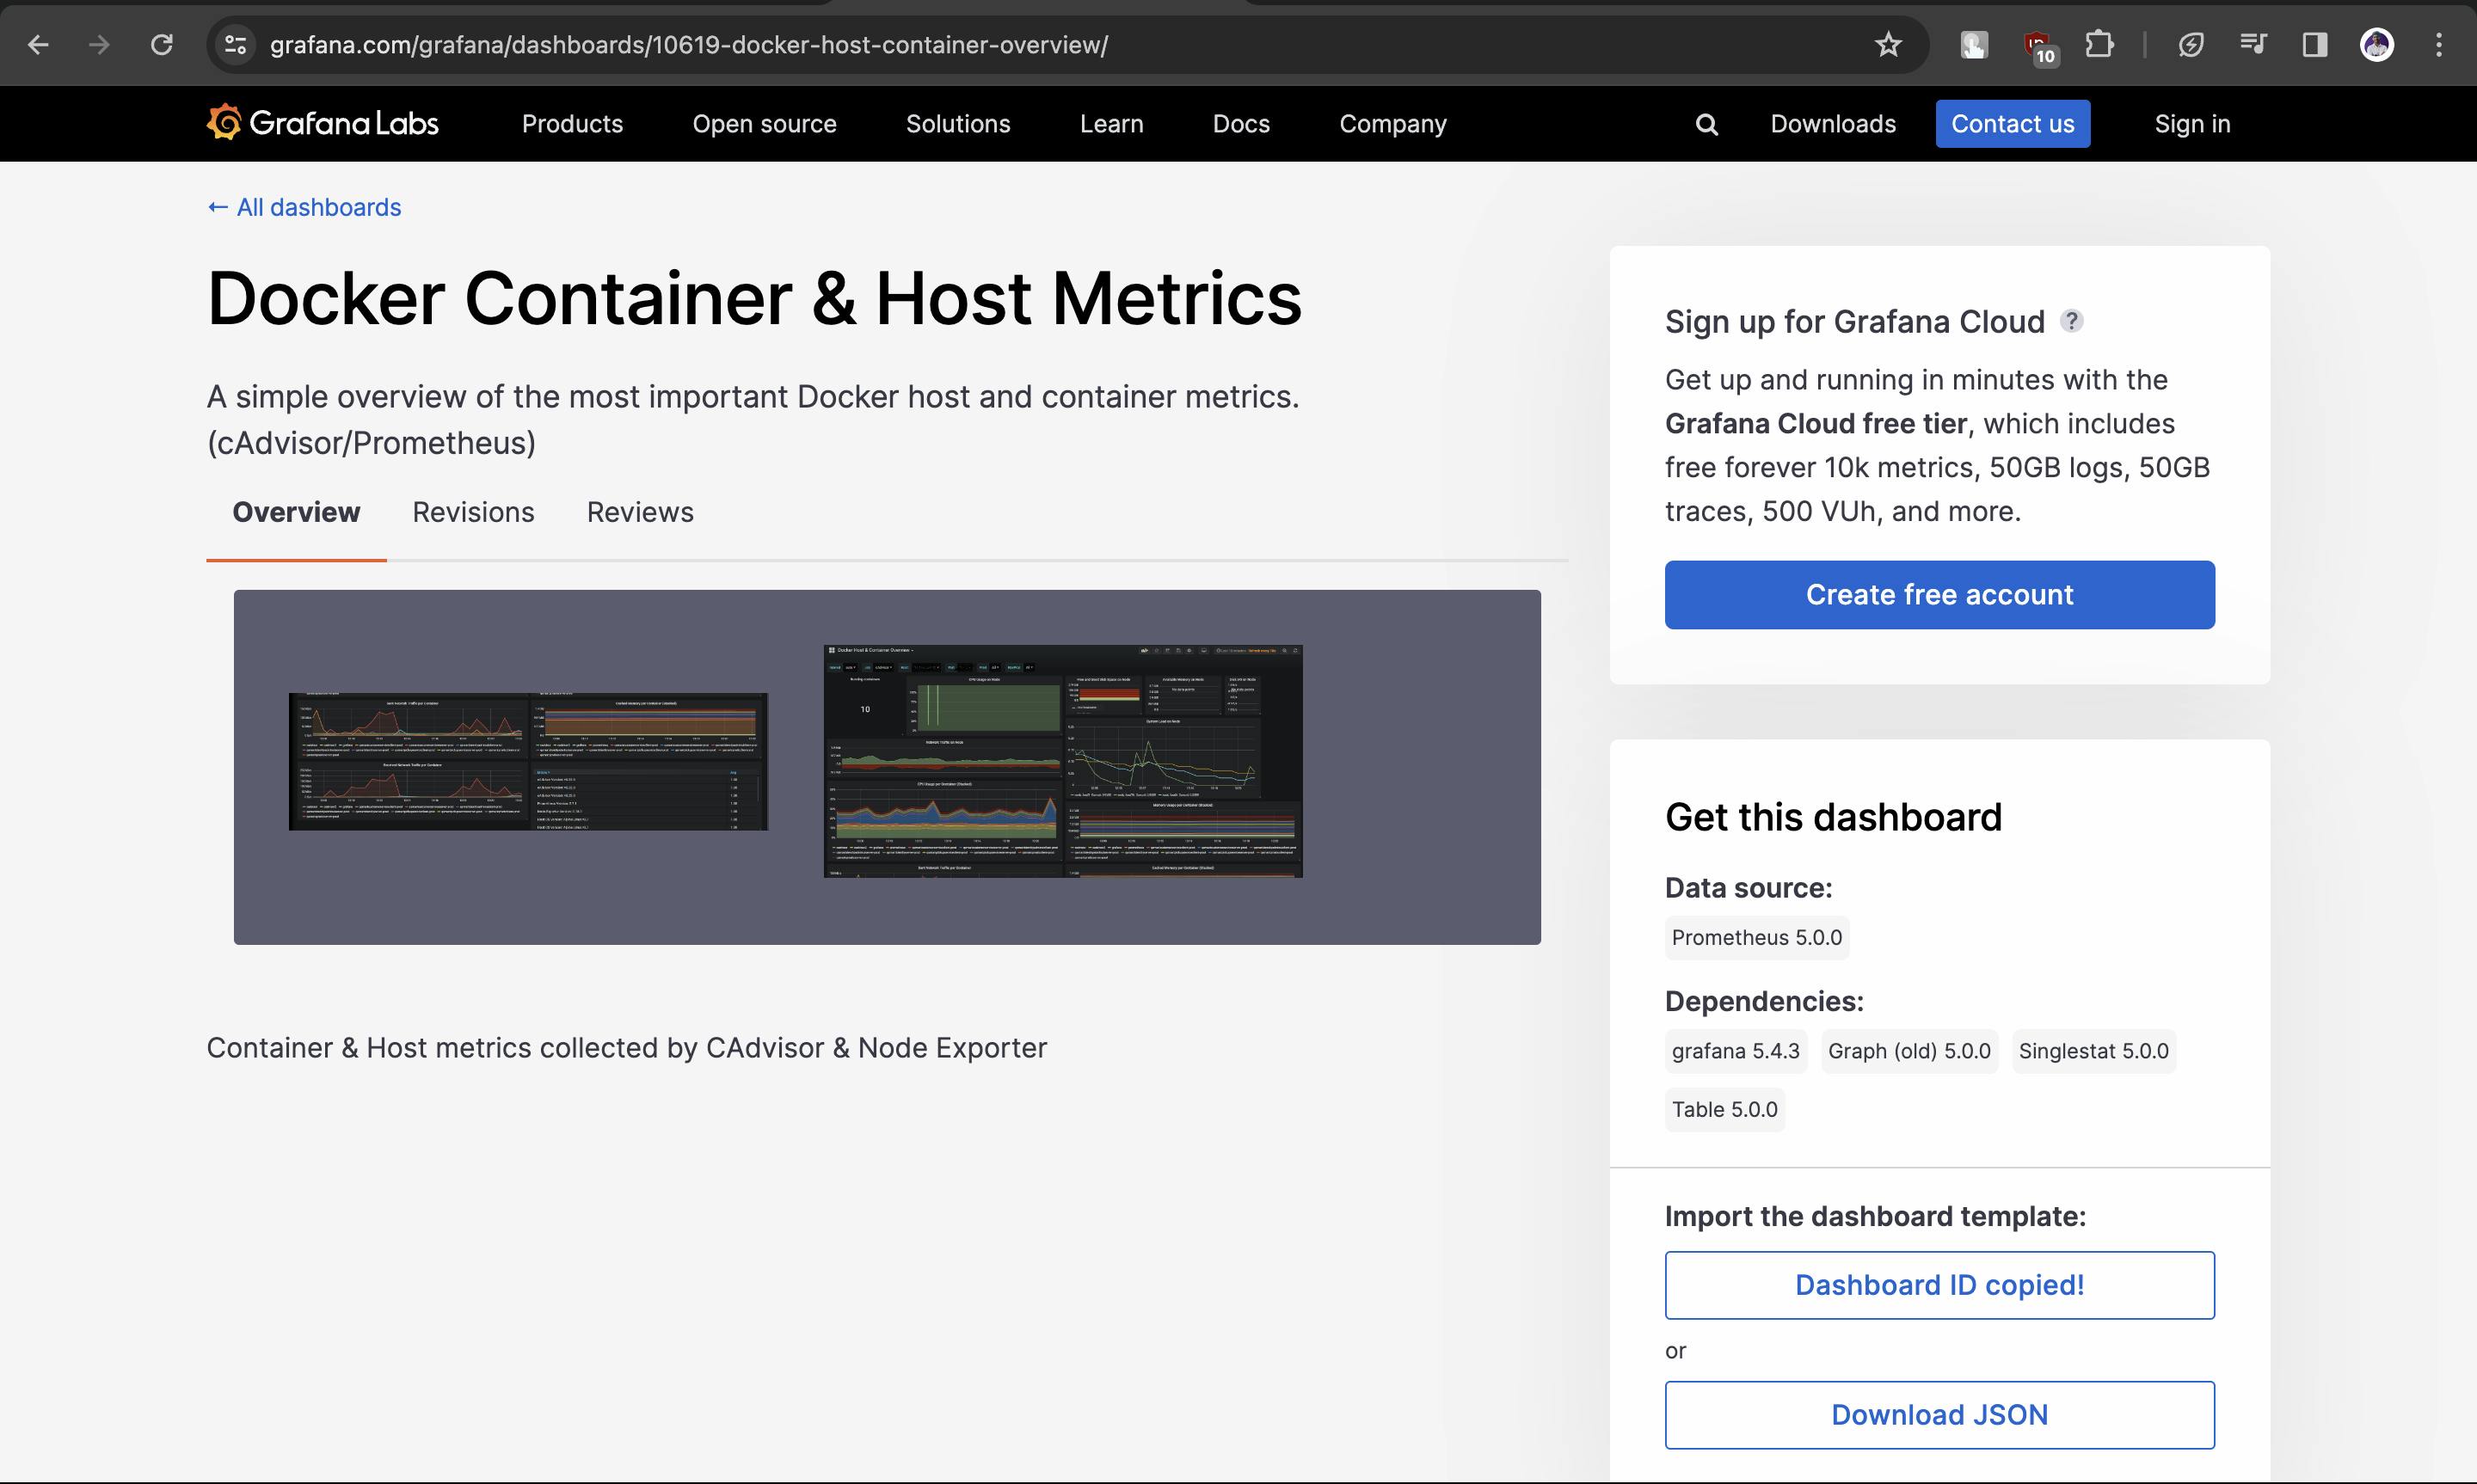
Now let's create a dashboard in our grafana and for that we will explore the grafana labs and as per our need we will choose Docker Container & Host Metrics copy the ID
https://grafana.com/grafana/dashboards/?search=docker
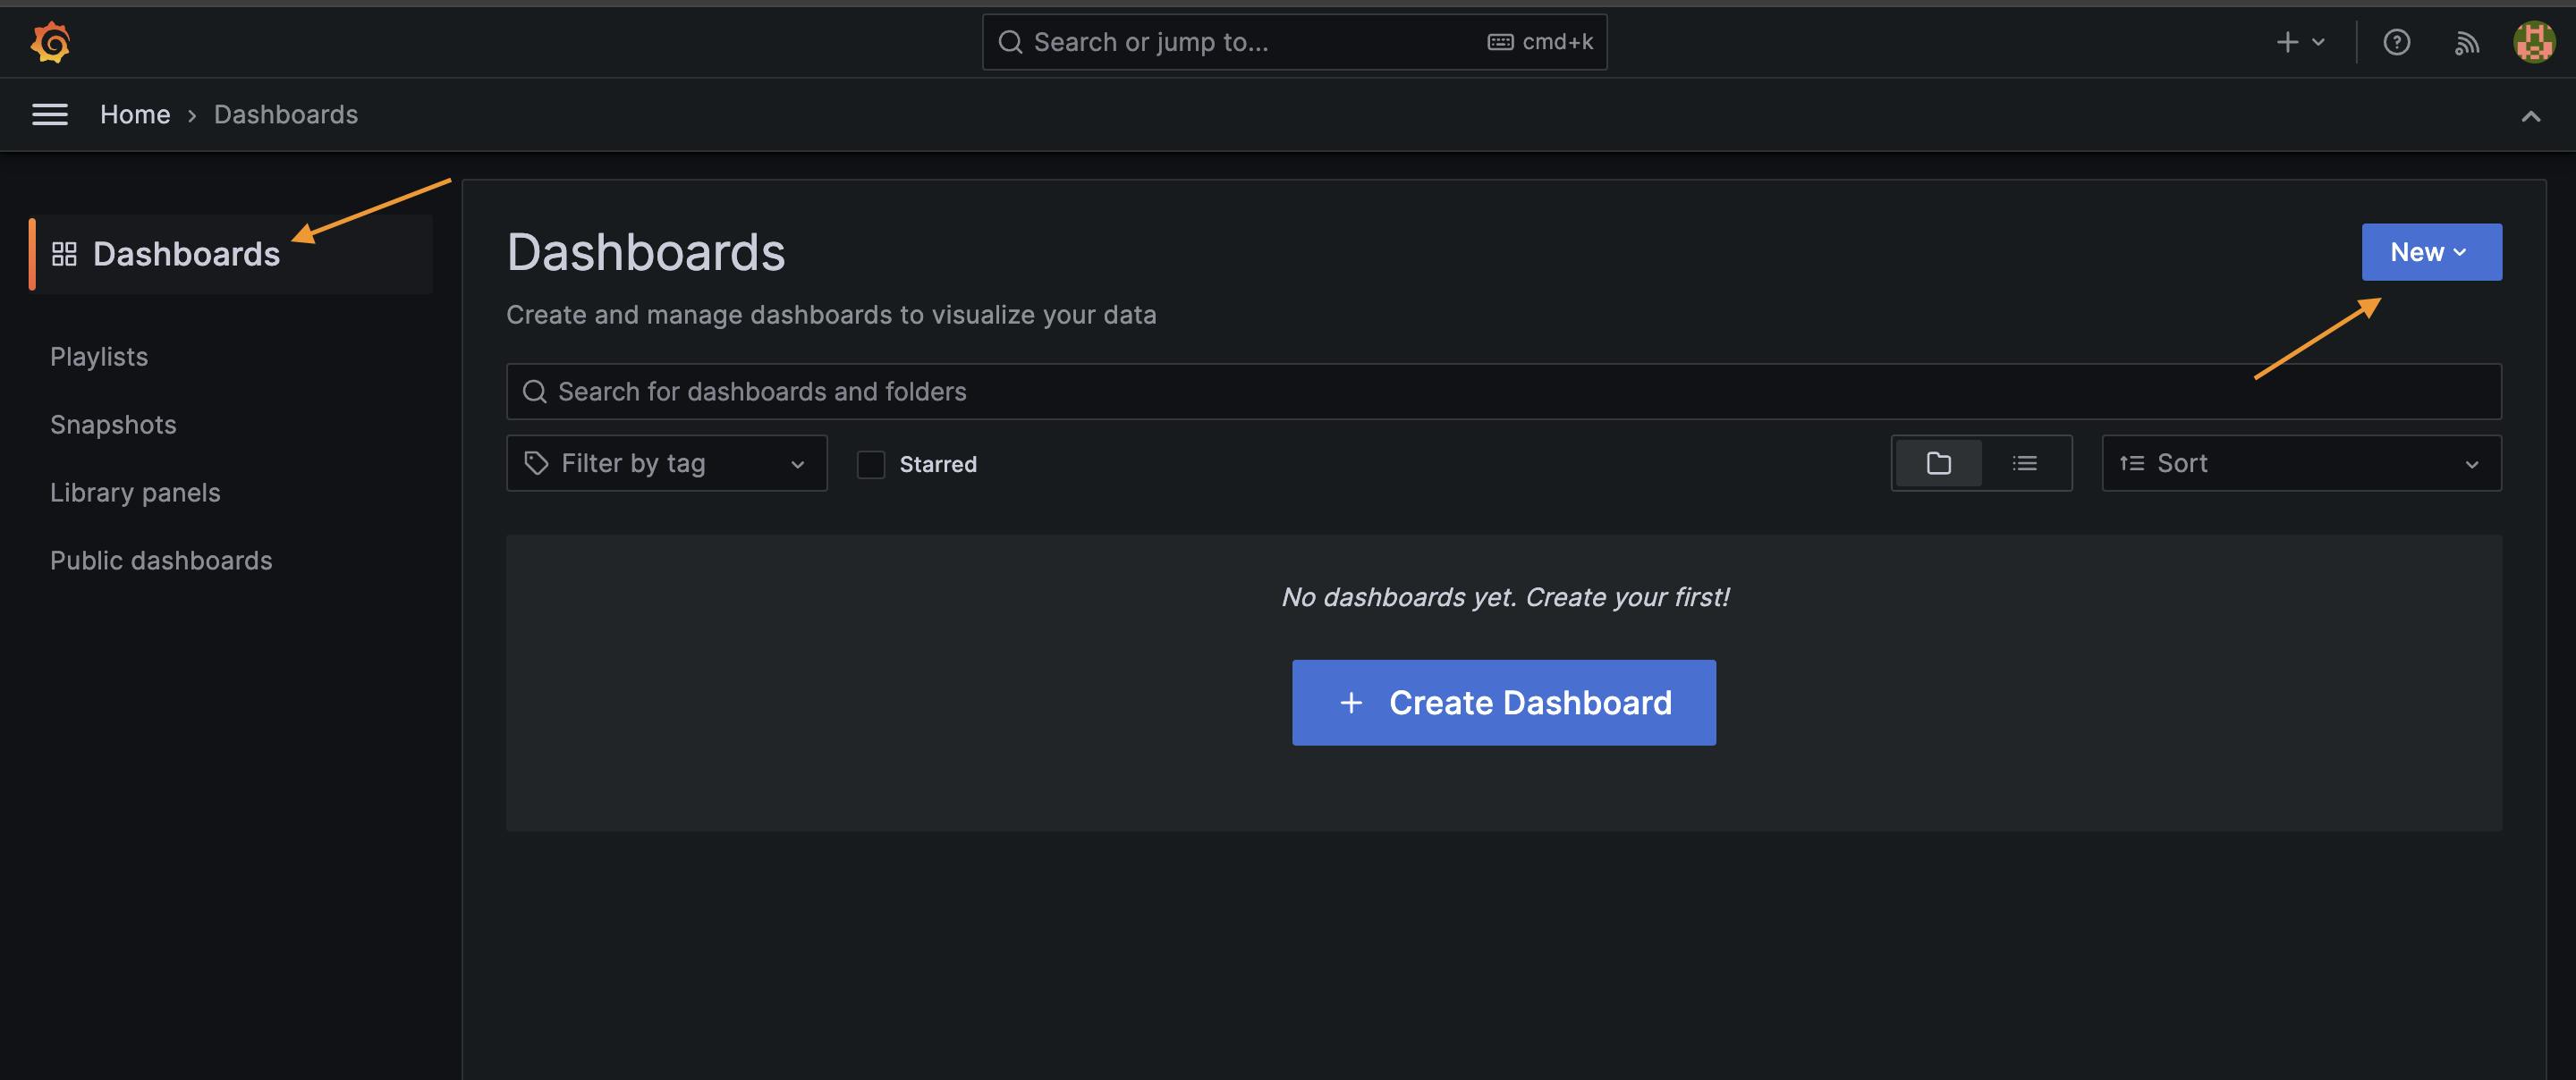
Now goto dashboard and click on new -> import
paste the dashboard ID we copied earlier
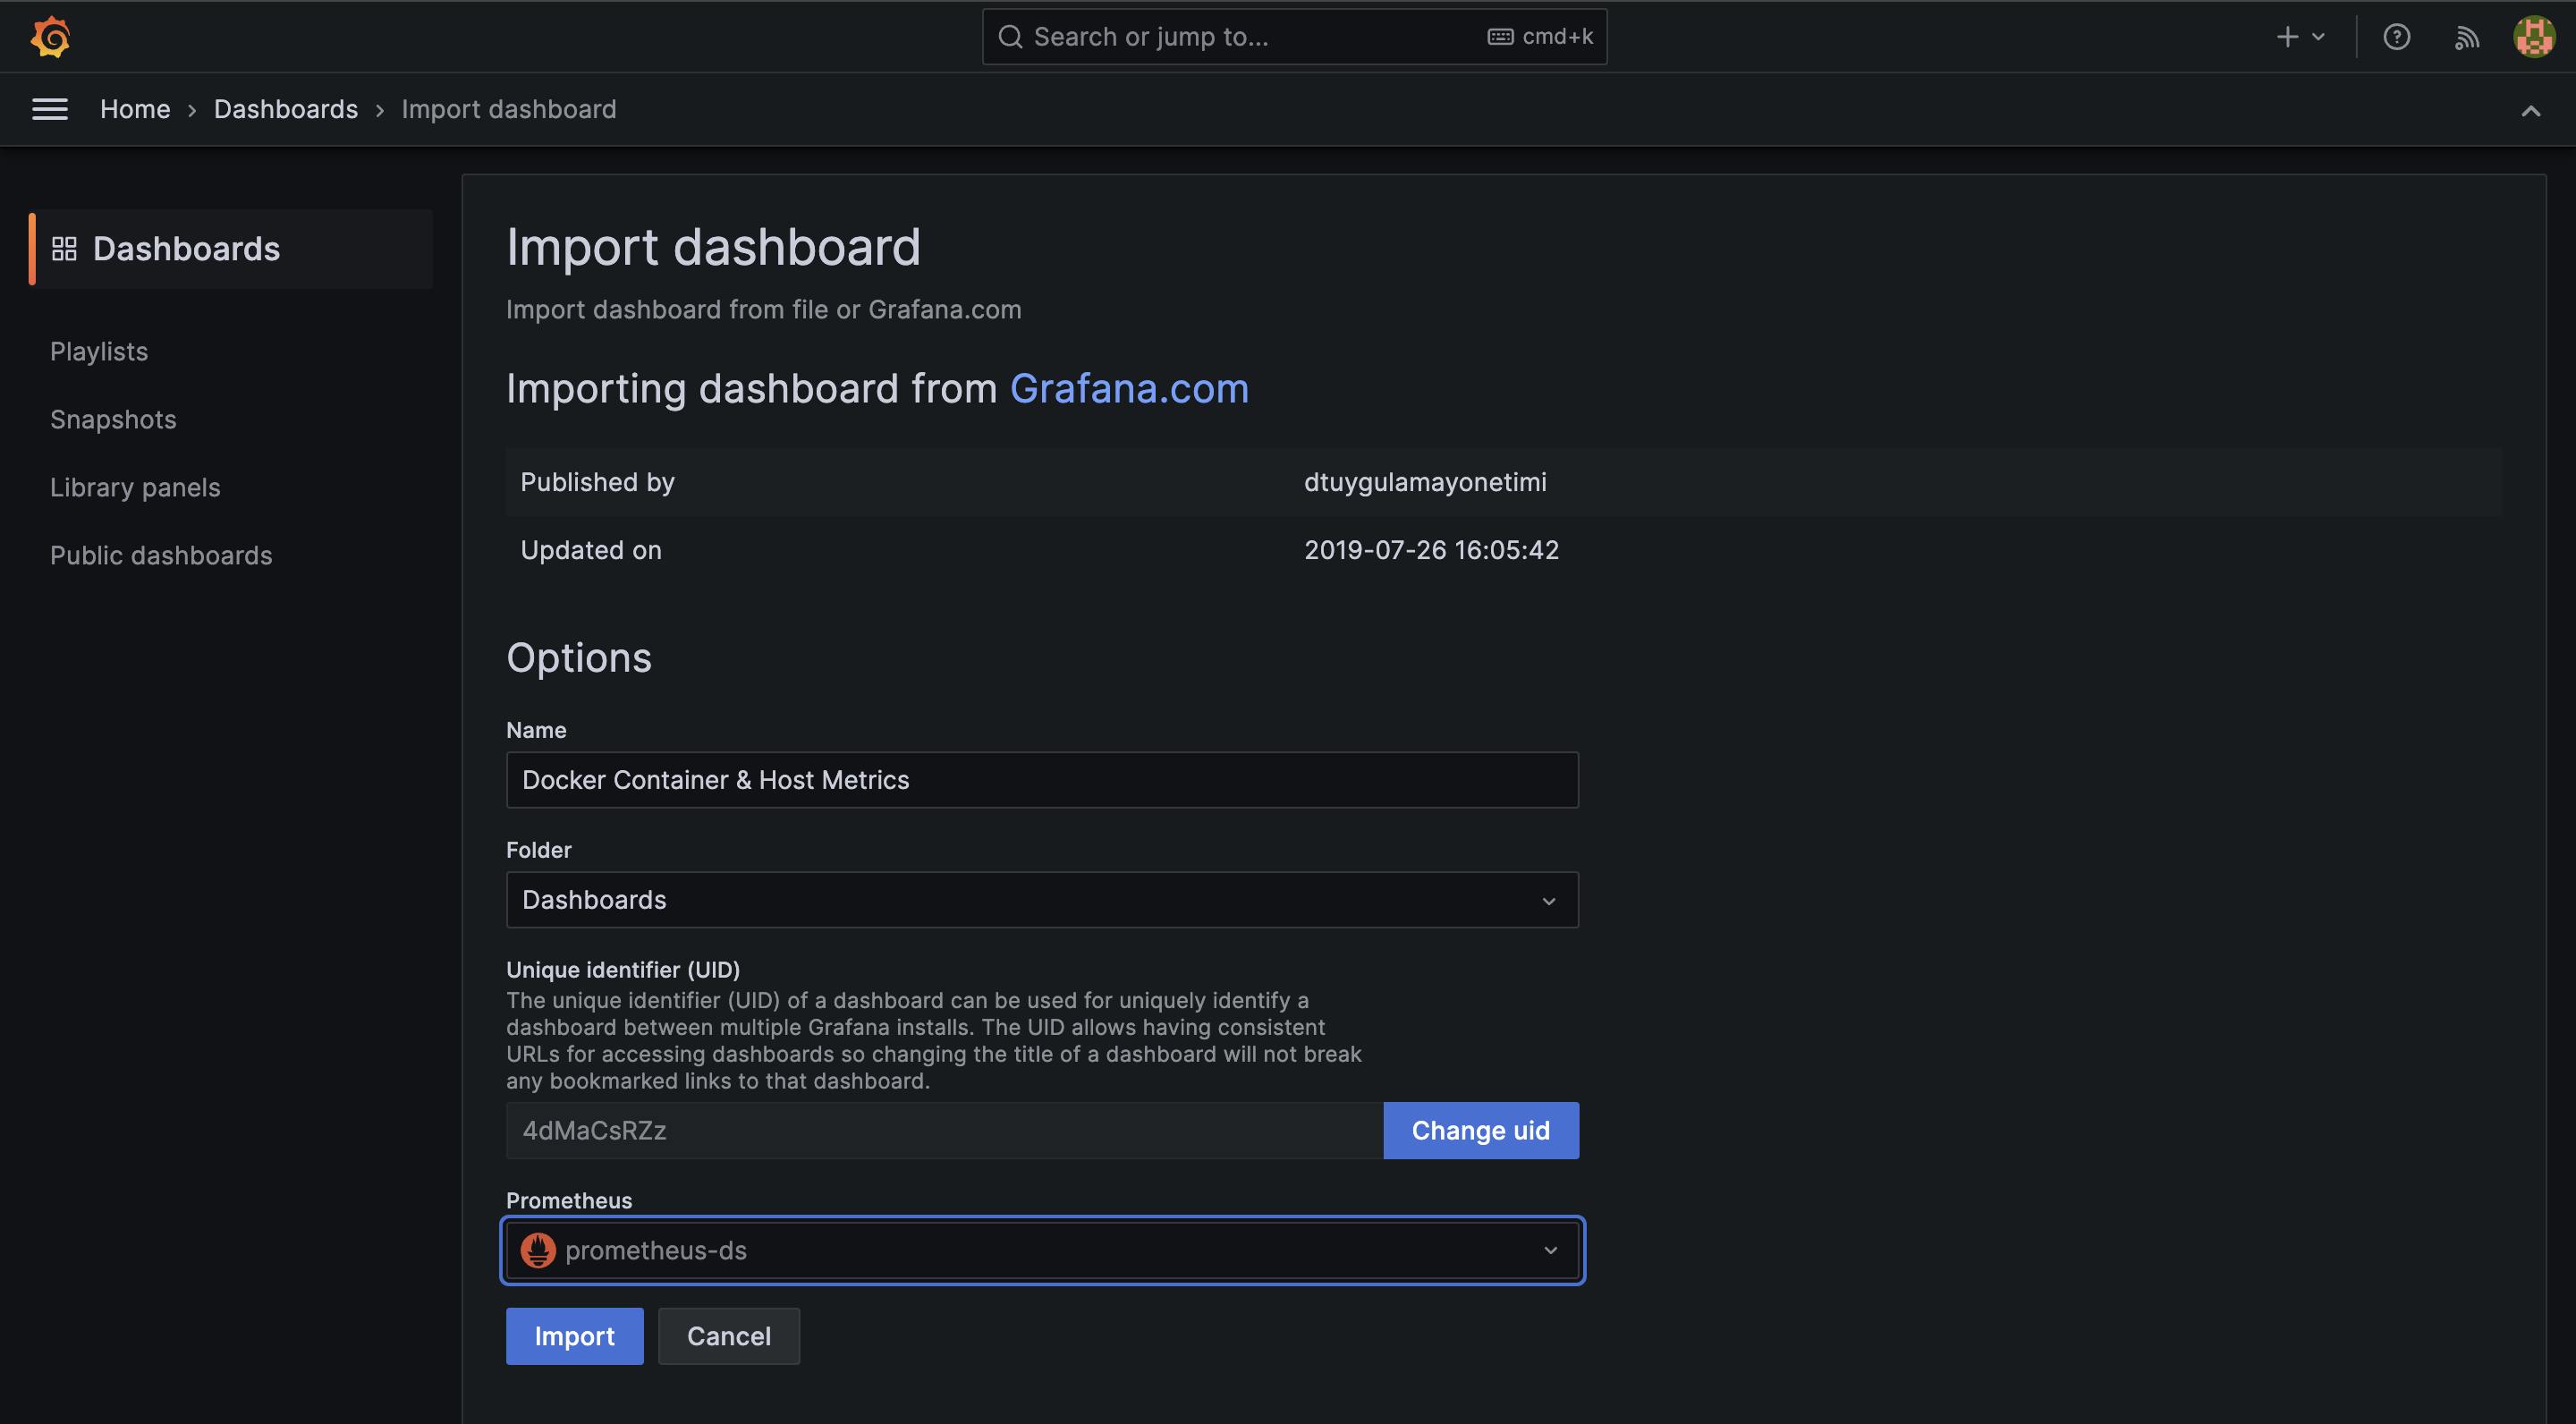
now select the datasource and tap on import, and our dashboard is created
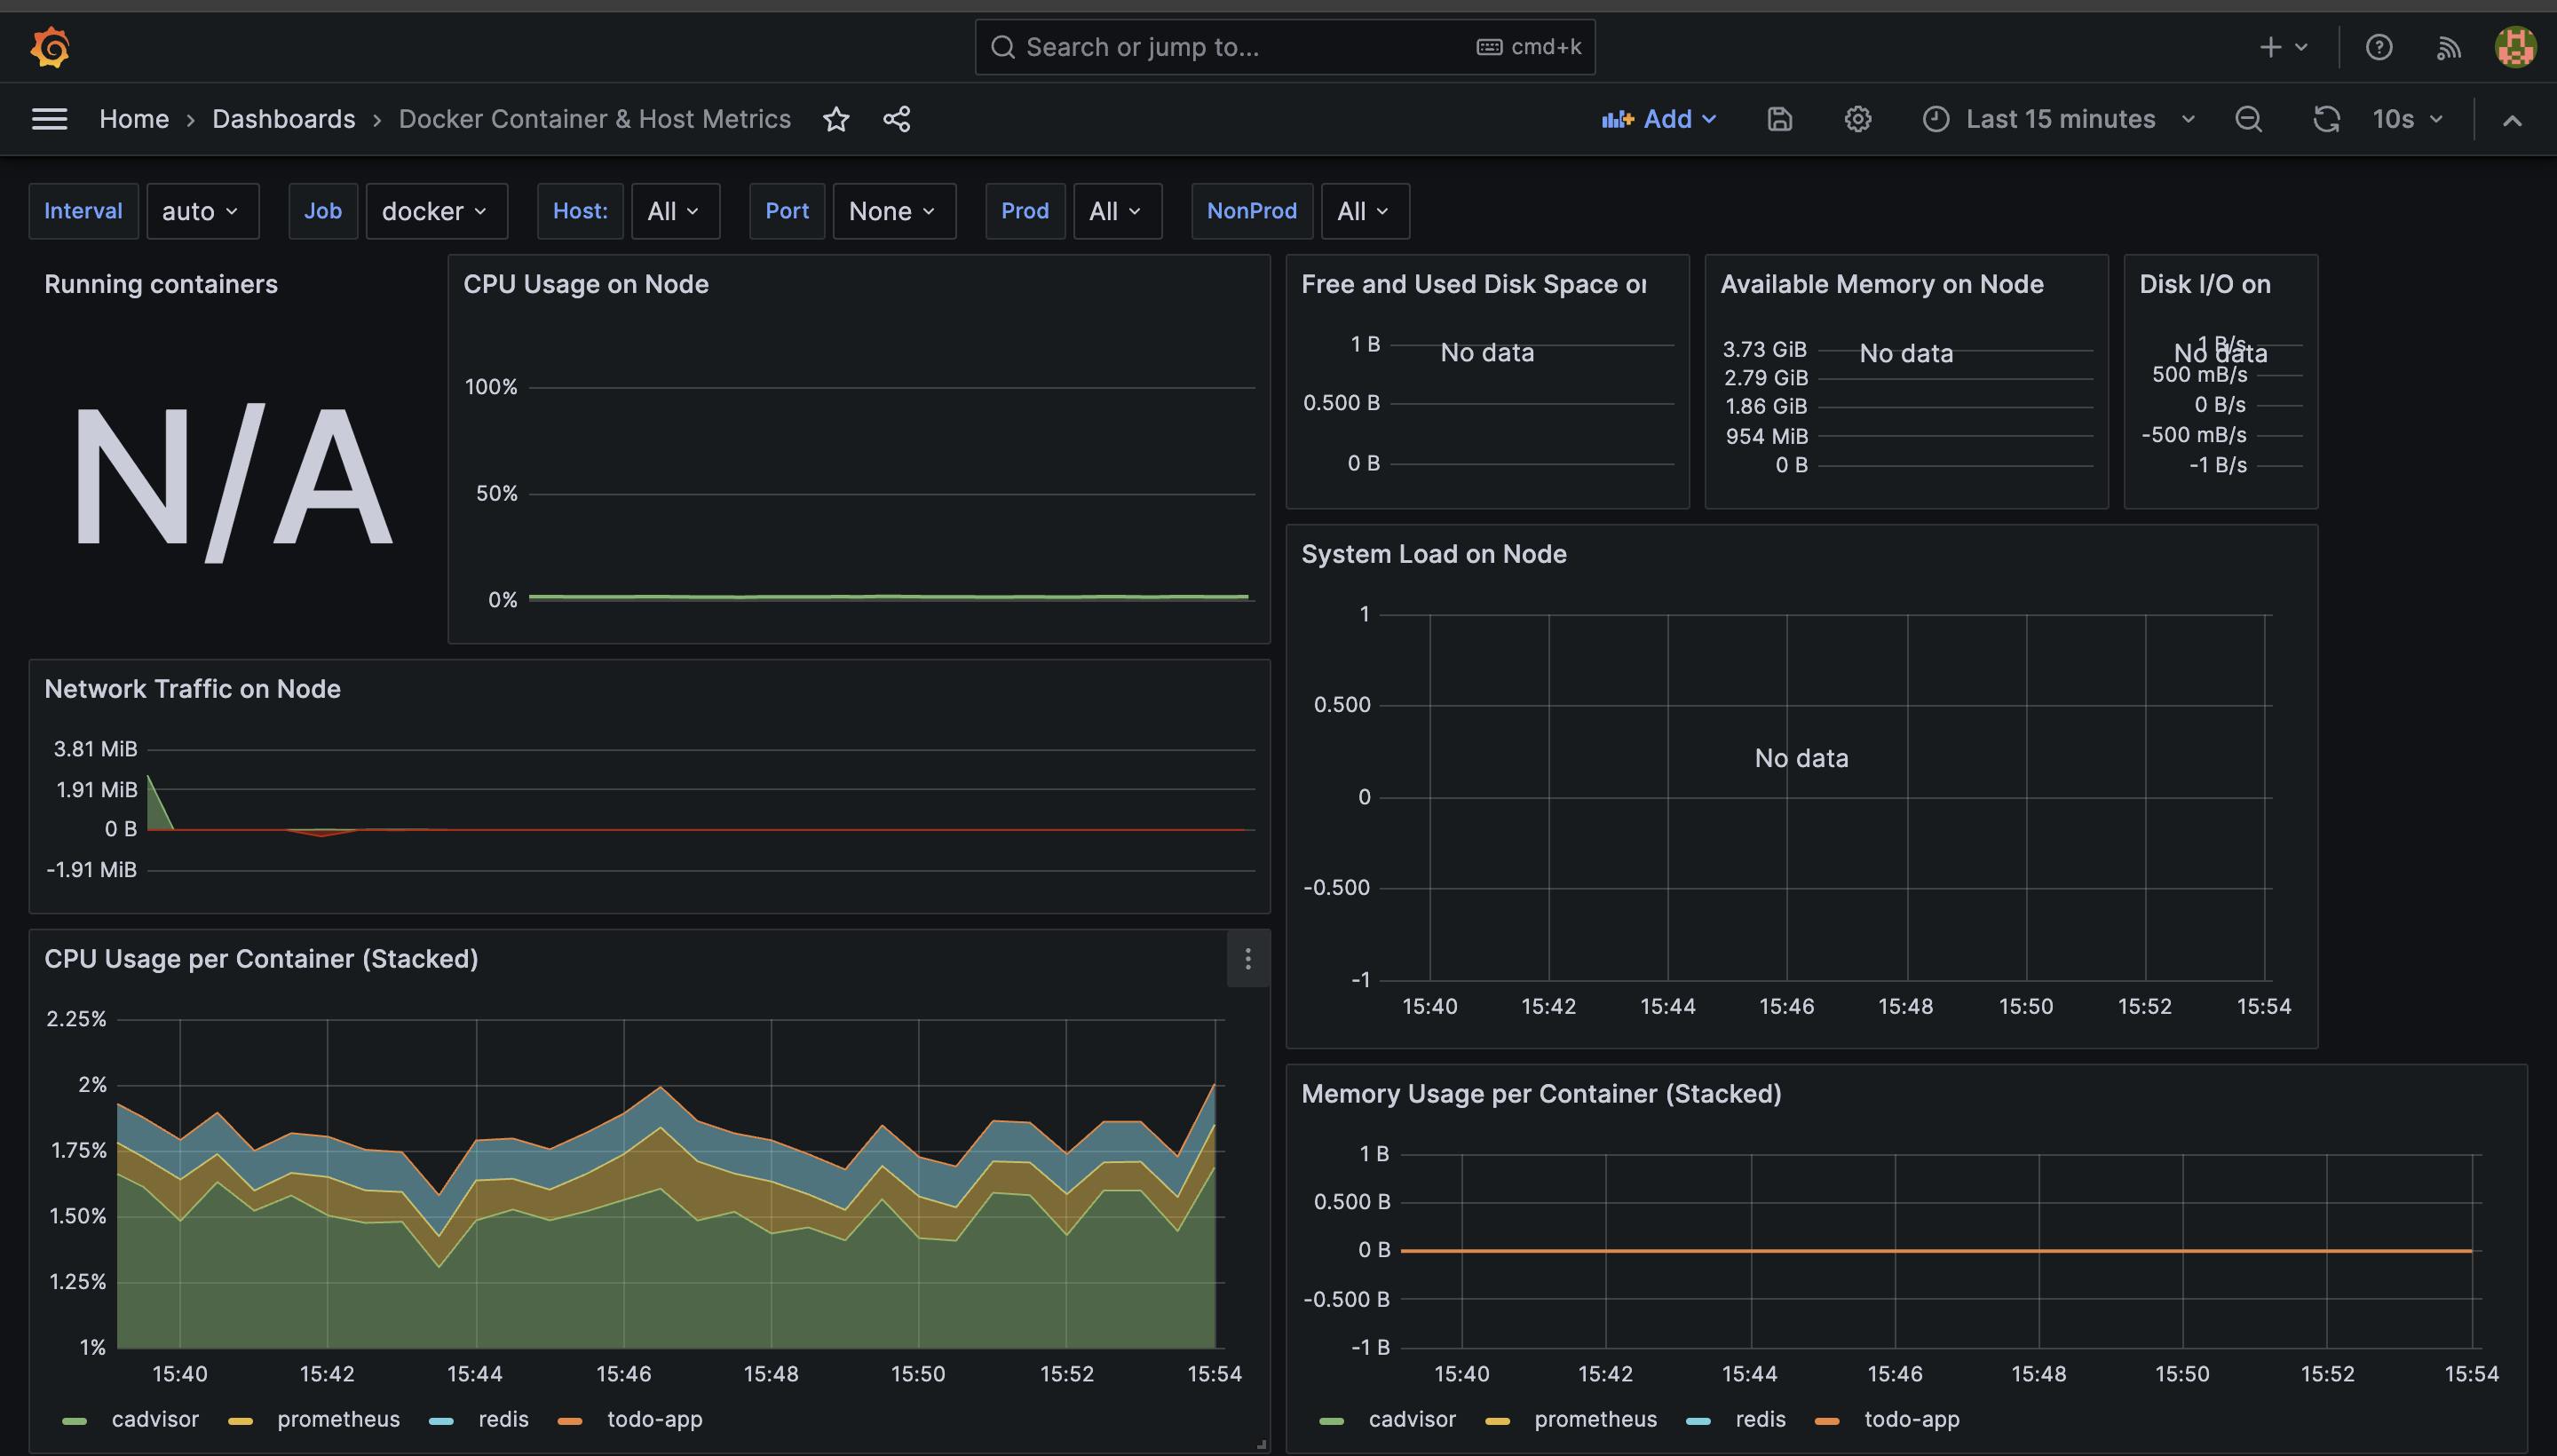
Conclusion
Congratulations! You've successfully set up Docker monitoring using Prometheus, cAdvisor, and Grafana. Dive into the world of containerized applications with confidence, armed with a robust monitoring system to ensure optimal performance and reliability. Happy monitoring!